A real execution · An inspectable tutorial
From an Order to a Verified Repair
The API returned 201 Created. The order was still wrong. Follow how three specialized agents discovered the mismatch, developed a fix, checked it independently, and opened a draft pull request—without a person handing an investigation to an agent.
Read this as a walkthrough of two specific runs: first, create a repair PR; second, encounter the same problem with that PR still open. The explanations and evidence below cover this setup and these decisions, not a general production deployment manual. A PR is a proposed code change on GitHub; opening it does not change the running service.
Solid arrows = work or evidence flow · dashed arrows = context · shapes have the same meaning throughout.
01 · Separation of responsibilities
Agents decide. Tools enforce and act.
Each agent uses the framework’s ordinary orchestration harness. Its model chooses a plan from discovered capabilities and receives results before deciding what comes next. Tools implement bounded operations; they do not choose the investigation’s next stage.
Coordinator
Reads the observation and contract, checks prior work, delegates when justified, requests publication, and records an evidence-backed case outcome.
maintenance-agentRepair
Examines source at the serving revision, stages exact file bytes and a regression test, and requests bounded verification jobs. It does not approve or publish its own work.
maintenance-repair-agentIndependent review
Reads the candidate bundle, original evidence, contract, and actual test artifacts. Returns a structured verdict tied to this candidate and verification.
maintenance-review-agentThe five tool servers: capabilities and boundaries
| Tool | Representative capabilities | Responsibility |
|---|---|---|
| Evidence | get_service_profile | Service facts, approved scope, accepted request and final effect, serving-build mapping. It does not diagnose a bug. |
| Source | resolve_source_revision | Allowlisted, bounded repository access at immutable commits. Snapshot transfer is tool-to-tool, not a binary archive in the planner prompt. |
| Workspace | create_workspace | Exact-byte candidate storage, content identities, sandbox jobs, bounded waits, logs and authoritative verification receipts. |
| Publication | list_open_remediations | Check current GitHub work; publish only a verified, reviewed candidate within the approved repository. No merge or deployment capability. |
| Assessment | find_related_assessments and case/issue record operations | Deterministic applicability and durable case evidence. These operations live in a tool, not disguised agent reasoning. |
02 · Reproduce the environment, not just the prompt
Configuration supplies authority and scope.
Where this ran: Kind is a Kubernetes cluster running locally in containers. Kubernetes kept the service, agents and tools running as separate processes in containers called pods. The solution lived in the software-maintenance namespace (a named grouping of resources); the retail service and shared infrastructure lived in truvag3-examples. The model calls left the cluster through OpenRouter, the API gateway routing them to the selected AI models. The models did not run inside these pods.
| What was configured | What it meant in this run | Where to check |
|---|---|---|
| Service profile | An operator-owned JSON configuration told the evidence tool which service endpoints it could read and where the approved requirements lived. It pointed to README.md at commit 9b8dae6…; the model did not invent the business rule. | Coordinator step-1, get_service_profile |
| Serving code versus requirements | The service reported build build-530a6bde…, mapped to source commit 11332d9…. A Git commit identifies one fixed repository version; this is separate from the contract’s commit. The tools resolved both before reading files. | Coordinator step-6 release lookup; step-7 and step-9 source resolution |
| Source, workspace and publication profiles | These restricted repository access, file paths, test commands and where a draft PR could be opened. A profile is tool configuration—not a prompt and not agent memory. Agents receive relevant profile IDs and tool-returned facts; the tools enforce the full policies. | Coordinator steps; repair workspace/candidate/job records |
| Models and role guidance | Sol planned tool calls, Luna handled auxiliary selections/summaries, and DeepSeek wrote final results. Versioned skill instructions supplied each role’s guidance. The same models and budgets were retained for the repeat. | Skills, actual prompts, model-call records |
| Storage and observation | Redis backed discovery and framework/application records; a Kubernetes persistent volume held test source trees. OTEL (OpenTelemetry) carried timing traces to Jaeger, while Loki stored logs. Registry Viewer read the emitted execution and memory records. | What each kind of state means; telemetry and evidence |
Prepare the platform
Go, a working container runtime, Kind, and shared Redis, OTEL, Loki, Jaeger, skills management and Registry Viewer services. Deploy the target service separately.
Set the boundaries
Provide credentials locally. Configure service/repository profiles, immutable contract and source references, approved runner commands, publication permission, admission limits and observability endpoints.
Deploy, bind, verify
Build all five tools and three agents with the solution’s setup script. Publish skills, verify their versions, run preflight, then explicitly enable bounded collection.
Setup commands and the latest-workspace build used here
Run from a reviewed checkout containing this implementation. This run used local framework changes; it is not evidence that an older published release has the same behavior.
cd examples/software-maintenance
./setup.sh help
cp .env.example .env    # only if .env does not already exist
# Fill local credentials and owner-approved profiles; keep collection disabled.
# For a cold start only: ./setup.sh full-deploy evidence
# With Kind and shared infrastructure already available:
for component in evidence assessment source workspace publication repair review coordinator; do
  MAINTENANCE_FRAMEWORK_SOURCE=workspace ./setup.sh rebuild "$component"
done
./setup.sh skills-sync
./setup.sh skills-check
./setup.sh preflight
Use rollout for configuration-only changes; rebuild for code or asset changes. Profile revisions and content hashes must remain consistent across components. See the solution source and README for the full operator setup—not just these commands.
The common system-utilities tool was also rebuilt for this acceptance run. No step used it: waiting happened through the workspace tool, so this workflow did not depend on another example’s sleep capability.
The actual budget profile—not the framework defaults
| Area | This run’s configuration | Interpretation |
|---|---|---|
| Planning / synthesis output | 128,000 / 30,000 tokens | Caps, not targets. None of the 43 calls ended with a token-limit finish. |
| Memory event summary / synthesis skill input | 10,000 tokens / 4,096 tokens | Separate summary-output and skill-projection budgets. |
| Phases / phase deadline | 25 / 19 minutes | 6 coordinator, 7 repair, 5 review phases actually used, including terminal phases. |
| Step / executor HTTP / server write | 14 / 18 / 21 minutes | Nested limits are not extra time added together; earlier enclosing deadlines still win. |
| Investigation task / AI chain calls | 20 minutes / coordinator 5 minutes, delegates 4 minutes | Coordinator finished in 350 seconds. These generous limits were not stress-tested by this run. |
| Continuation / result trimming | 192 KiB total / 64 KiB per result / 192 KiB aggregate | Prompt projections are bounded; authoritative evidence remains in stores. |
| Tiered capability selection / plan refinement | Disabled / disabled | Runtime discovery still supplies the catalog. Skill selection is a different mechanism and remained active. |
| Reasoning multiplier | 1×, example override | Do not infer the adapter’s default multiplier from these calls. |
The checked-in .env.example documents overrides. Secrets belong only in local configuration. No secret file is included in this tutorial bundle.
Namespace: software-maintenance. Shared infrastructure: truvag3-examples. Image identities and build logs are preserved in the evidence bundle. At capture end, collection was disabled again to prevent unbounded paid investigations.
03 · The trigger was service traffic
A timer does the polling.
The model does the investigation.
The external test driver sent an authenticated POST /orders, just as a client would. The service saved the accepted order and exposed an observation: a record of that request’s behavior, including its final total and an identifier for the saved order. This is business evidence, not an LLM-generated memory summary.
The coordinator’s scheduled collector ran once a minute, read the service’s observation feed through the evidence tool, and applied the configured sampling and admission limits. Admission means accepting an observation for investigation. It created a case (the application’s investigation record) and queued a task (the worker’s unit of work). A worker then started the coordinator’s orchestration execution. No human supplied a diagnosis to that execution.
Bounded acceptance run
One successful observation was deliberately sampled for this controlled test. Admission allowed one case, one pending investigation and one case per window. Normal successful-response sampling returned to 1-in-5 afterward.
No failure status required
The observation was an HTTP success. The planner compared business evidence with the pinned owner contract to decide whether it deserved repair. The scheduler did not label it a discount bug.
Read the traffic, admission and final case records
How to test this automatically in your own bounded environment
- Deploy and verify the service, profiles, agents, tools and skills first. Configure a fresh admission run ID and an explicit paid-run ceiling. Choose a successful-observation sample rate appropriate for the test.
- Enable collection in the maintenance profile only after its readiness checks pass, and redeploy the profile readers through
setup.sh. The checked-in profile is disabled by default. - Send an ordinary request to the target service—not an investigation request to an agent. Use a unique order ID so idempotent replay does not reuse a previous outcome.
- Wait for the scheduler to collect it. Follow observation ID → case → task → coordinator → delegated executions → publication receipt.
- Check the patch, baseline failure, candidate tests, independent review, final case and telemetry. A 200 from an agent or a PR URL alone is insufficient.
- Disable collection when the bounded test ends; preserve its ledger and proof before retention expires.
The accepted request in this run was:
{
  "order_id": "auto-20261008T201934.393464000Z",
  "sku": "COFFEE-250",
  "quantity": 5,
  "promotion_code": "WELCOME100"
}
This is the captured request, not a command to replay it now. If a correct PR already exists, a real-world run may appropriately link it instead of opening a duplicate. For this fresh-publication check, the older discount PR #12 was explicitly closed without merging; unrelated PRs #11 and #14 were left open.
04 · Capabilities are discovered; guidance is bound
A new tool can appear without
rewriting the agent’s workflow.
A capability is a named operation with declared inputs and outputs, such as reading a file or starting verification. Agents and tools register these operations in the shared registry. A skill is written guidance: how to compare evidence, handle uncertainty and report an outcome. The framework inserts the applicable skill text and available capability descriptions into model prompts; neither is a fixed list of steps the agent must execute.
The registry tells the harness what capabilities are available now. Skill packages tell a role how to handle evidence and uncertainty. They are different inputs: publishing a skill does not automatically bind it to every agent, and discovering a tool does not require calling it.
Always available
Safety and result contracts are required. Coordinator remediation guidance, the repair role and independent-review guidance are always-on, so an optional selector cannot remove the role’s essential rules.
Selected when relevant
Evidence investigation, outcome assessment, patch development and PR reporting have role-specific bindings. Luna selects optional skills/resources; execution records preserve activation and projection decisions.
Observed, not assumed
The saved skills check matches all 11 package versions. This run used skill activation, resource selection and synthesis projections. No tier-select LLM call was used to reduce the capability catalog.
Inspect each agent’s actual bindings, versions and required flags
The catalog also contained unrelated capabilities. The planner did not use travel, weather or OpenClaw to repair this order service. Broad discovery demonstrated interoperability here, but the large prompts also show its cost; this run is not a benchmark of minimal context.
05 · Open the model envelope
See how context became a decision.
A prompt is the input sent to a model: role instructions, the admitted case, available operations, selected skill text, historical context and—in later phases—earlier tool results. A model response can be a plan or a final answer. Tool responses are separate: they contain the files, order records and test evidence that the next model call can use. The model does not independently browse GitHub; its planned source-tool calls fetch that material.
The input/output counts below are tokens, the model’s units of text processing, not file bytes. Token budgets are ceilings on generation; they are not a request to write that much. KiB in the budget table means 1,024 bytes. The generous settings describe this diagnostic setup, not a minimum resource requirement.
The excerpts below come from the captured debug records. Select one to see the actual input or output, its role in the run, and its JSON location. They are not rewritten “ideal prompts” or hidden model reasoning.
{{step-2.response.data.outcome_reference.outcome_id}}. It passed the exact outcome ID from the observation into the next call. The same pattern carried observation.serving_revision into release lookup. The executor resolves references; the model does not need to retype identifiers.06 · Follow the real execution
One parent. Two delegated executions.
A decision after each phase.
The planner is a model call that proposes a JSON plan. The framework’s executor validates it, supplies earlier results to dependent steps and calls the chosen agents or tools. One cycle of planning and execution is a phase; a step is one operation within it. Ready, independent steps can run together. Synthesis is the final model call that turns accumulated evidence into the agent’s result. The orchestration harness is the framework code managing this cycle, budgets, validation and recording.
Coordinator phases 1–2
Establish what is true
Read service scope and the exact observation. Discover current open PRs and related assessments. Read the accepted outcome, serving revision, contract, runtime configuration and relevant source. Inspect PR #11 and #14: neither changes promotion arithmetic.
Coordinator phase 3
Delegate an evidenced problem
Create an immutable source snapshot. Ask repair to address the contract/outcome mismatch. The repair agent runs its own seven-phase investigation; it is not a single opaque model completion.
Coordinator phase 4
Ask a second role to check
Delegate candidate review. The reviewer reads the original facts, bundle, source and all three job artifacts. It reconciles verification that was initially pending and issues an approval tied to exact evidence.
Coordinator phases 5–6
Publish, then stop
Request the draft PR with the candidate, verification and review receipts. After the publication result returns, emit a terminal plan, record memory and synthesize a result. The case and assessment are persisted.
How did it inspect the code: full repository or file by file?
For reasoning, file by file. For test execution, a separate source snapshot. The source tool used GitHub’s commit, tree and file-content APIs. It did not give the model a local shell or clone the repository into the agent pod. File names, selected file text and search results came back as tool responses for subsequent planning calls. Listing the tree showed what files existed; it did not load all their contents into the prompt.
| Who read what in the first run? | Why that mattered | Exact evidence |
|---|---|---|
Coordinator: README.md, checkout.go, catalog.go; patches for PRs #11 and #14 | Compare the promised discount with serving arithmetic and prices; establish that existing open work did not fix this observation. | Steps 8, 13, 14 and 11–12 |
Repair: listed 22 allowed files; read README.md, checkout.go, checkout_test.go, service.go, service_test.go, store.go, catalog.go, contract.go | Understand the calculation, request handling, persistence interface and existing test helpers before proposing a change. All eight file responses reported truncated:false: those file reads were complete. | Step 8 tree listing; steps 5, 9–13, 15–16 file reads |
Reviewer: read the candidate’s two file previews, original README.md, checkout.go, service.go, service_test.go; searched for checkout( | Check the proposed change against original behavior and its callers, instead of accepting the repair agent’s summary. It also read all three test-job logs. | Steps 2/9 bundle, 8/11/16/17 files, 15 search, 12–14 logs |
How did it know where to look? The coordinator first derived the discrepancy from the order and README: 1000 × 5 − 100 = 4900, versus the saved 4500. Its direct checkout.go read exposed (UnitPrice − Discount) × Quantity, which explains 4500. It passed this evidence and a hypothesis—not just “fix the repo”—to repair. Repair chose additional files from the repository listing; review later searched call sites. The saved plans show those choices, not a whole-repository scan.
Where the runnable files were actually stored
Coordinator step-15, create_source_snapshot, asked the source tool to package the allowed regular files at serving commit 11332d9…. The response records 22 files, 71,603 uncompressed bytes, a 25,642-byte compressed archive and one excluded entry. This was a filtered snapshot—not a Git clone with repository history—and the archive itself was not sent to the model.
Repair step-14, create_workspace, caused the workspace tool to download that archive internally, verify its identity and unpack it on the cluster’s maintenance-workspaces persistent volume. A persistent volume is disk storage mounted into pods. The workspace ID names this case’s original source tree. Test jobs later mounted the appropriate copy at /workspace; they did not edit the running order service or this laptop’s checkout.
“Immutable” here means identified by fixed content and commit hashes rather than the moving name main. A hash is a fingerprint used to detect changed bytes; it does not by itself prove the code is correct. Snapshot receipt · Workspace and candidate records.
In the repeat run, the coordinator needed only the pinned README, serving checkout file and current PR #15 patch. It created no snapshot or workspace and ran no tests, because it stopped before proposing another repair.
The actual Registry Viewer screens
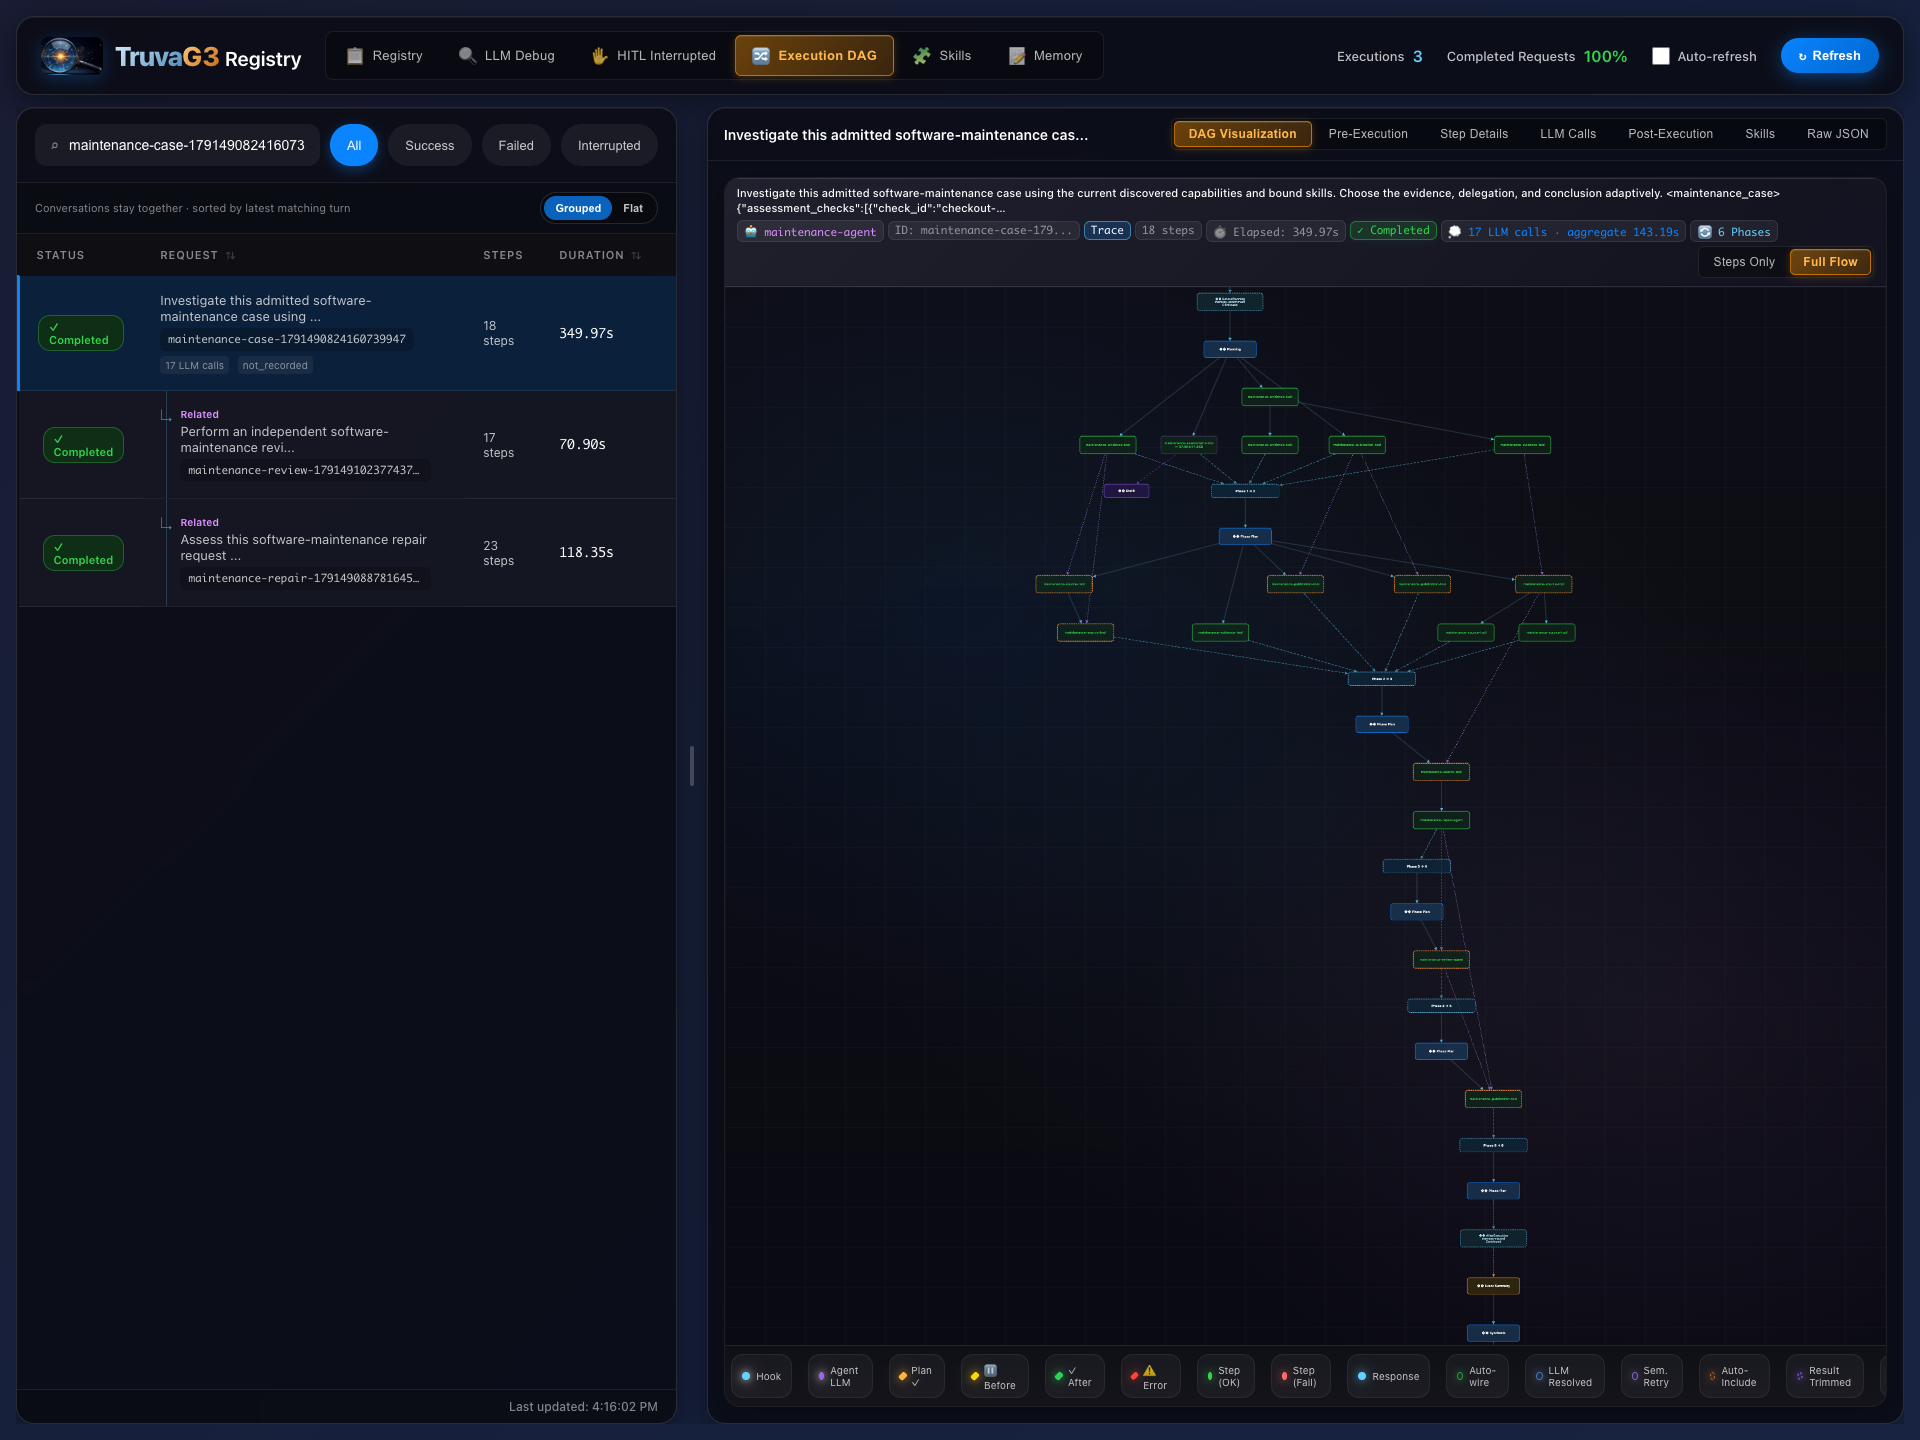
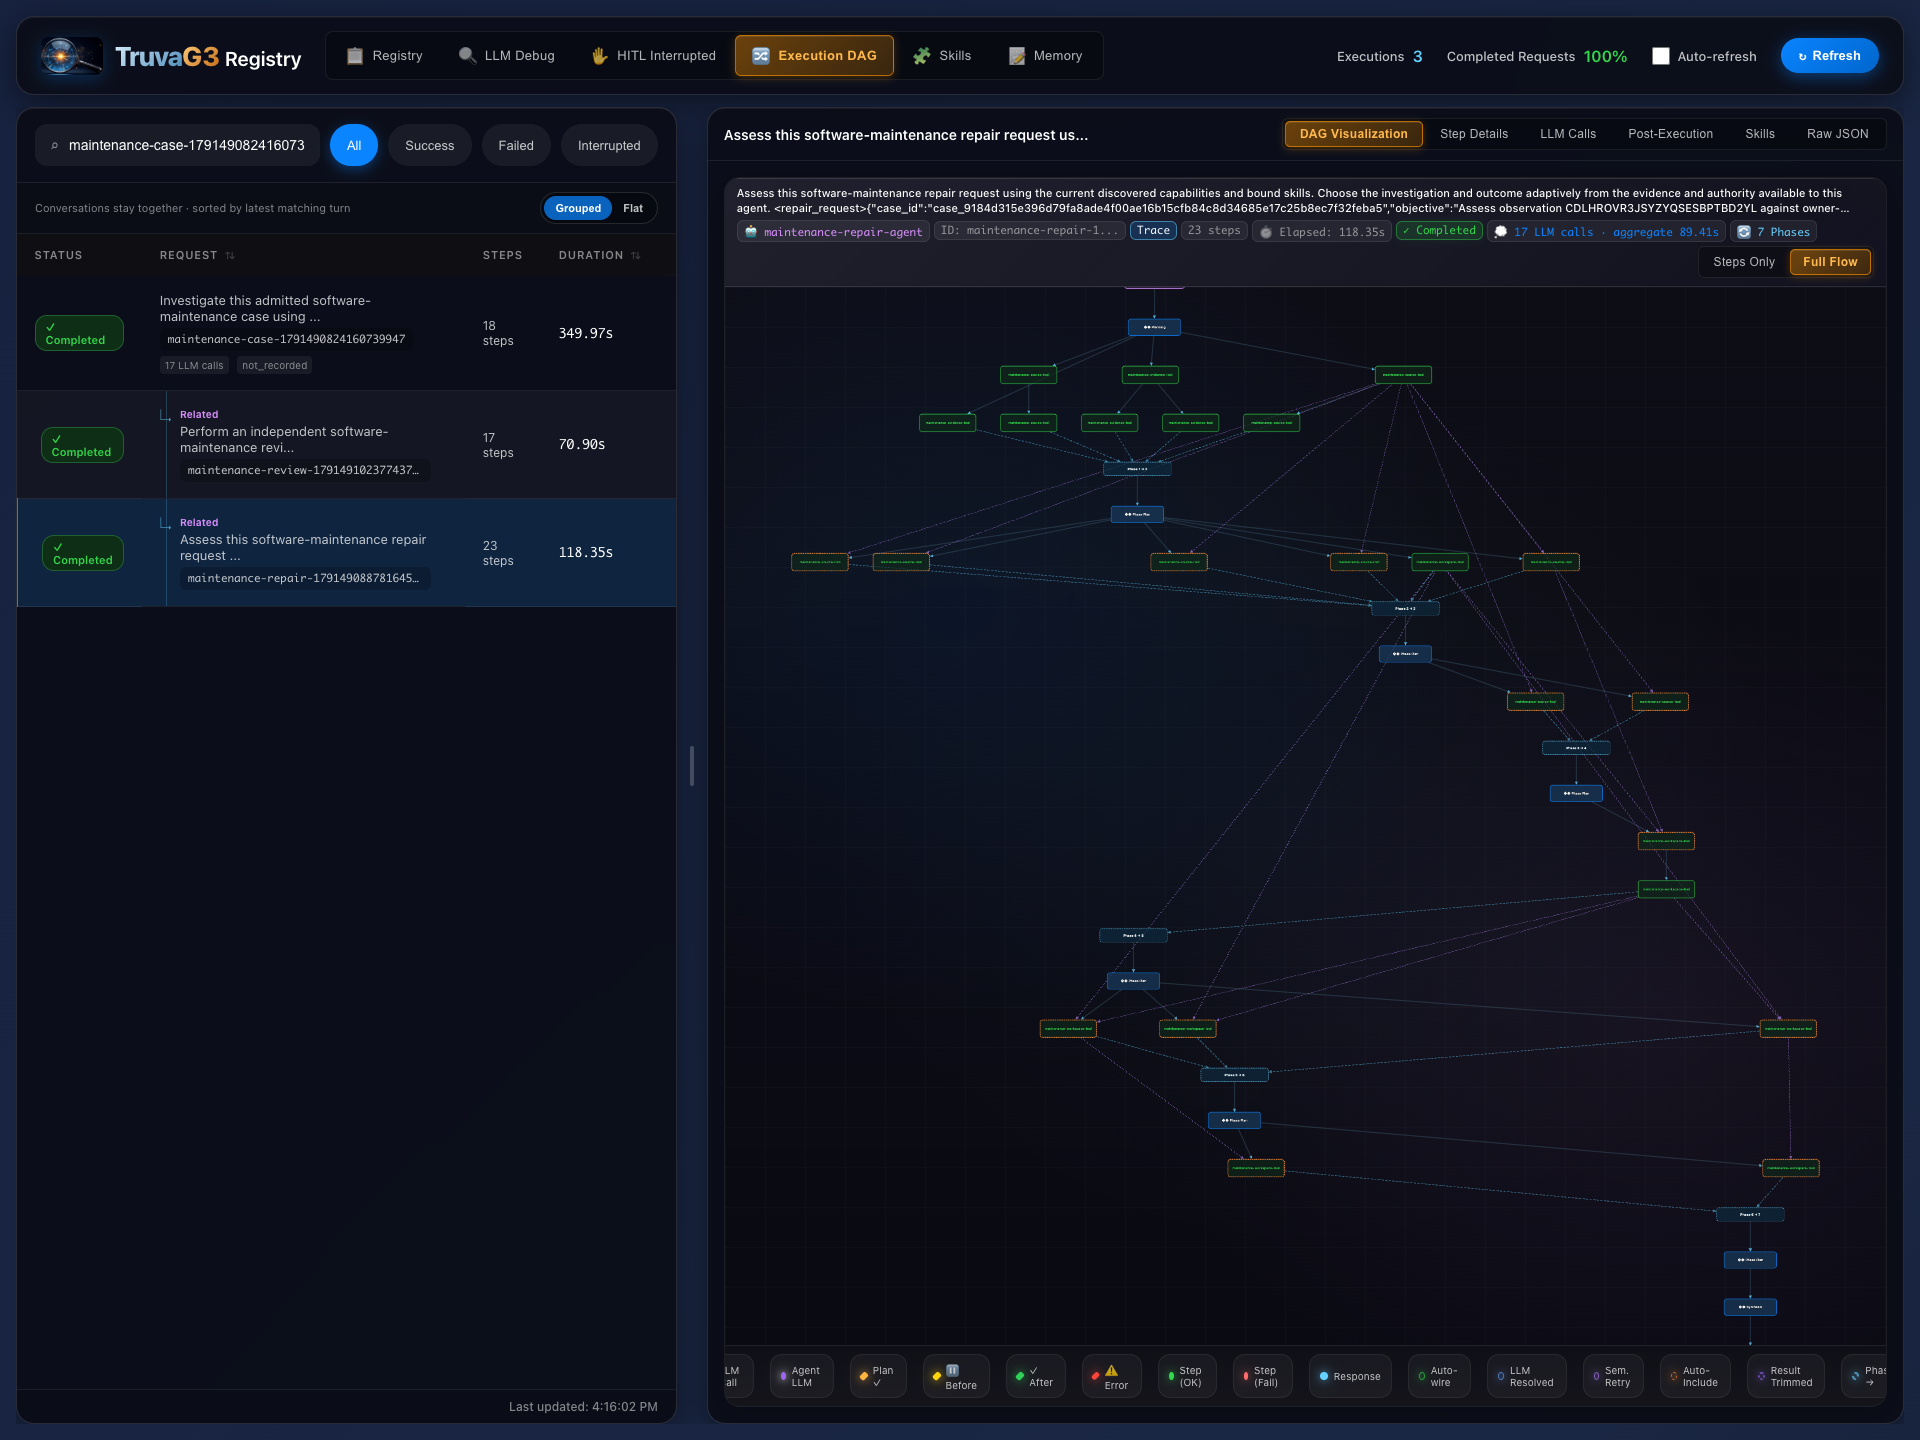
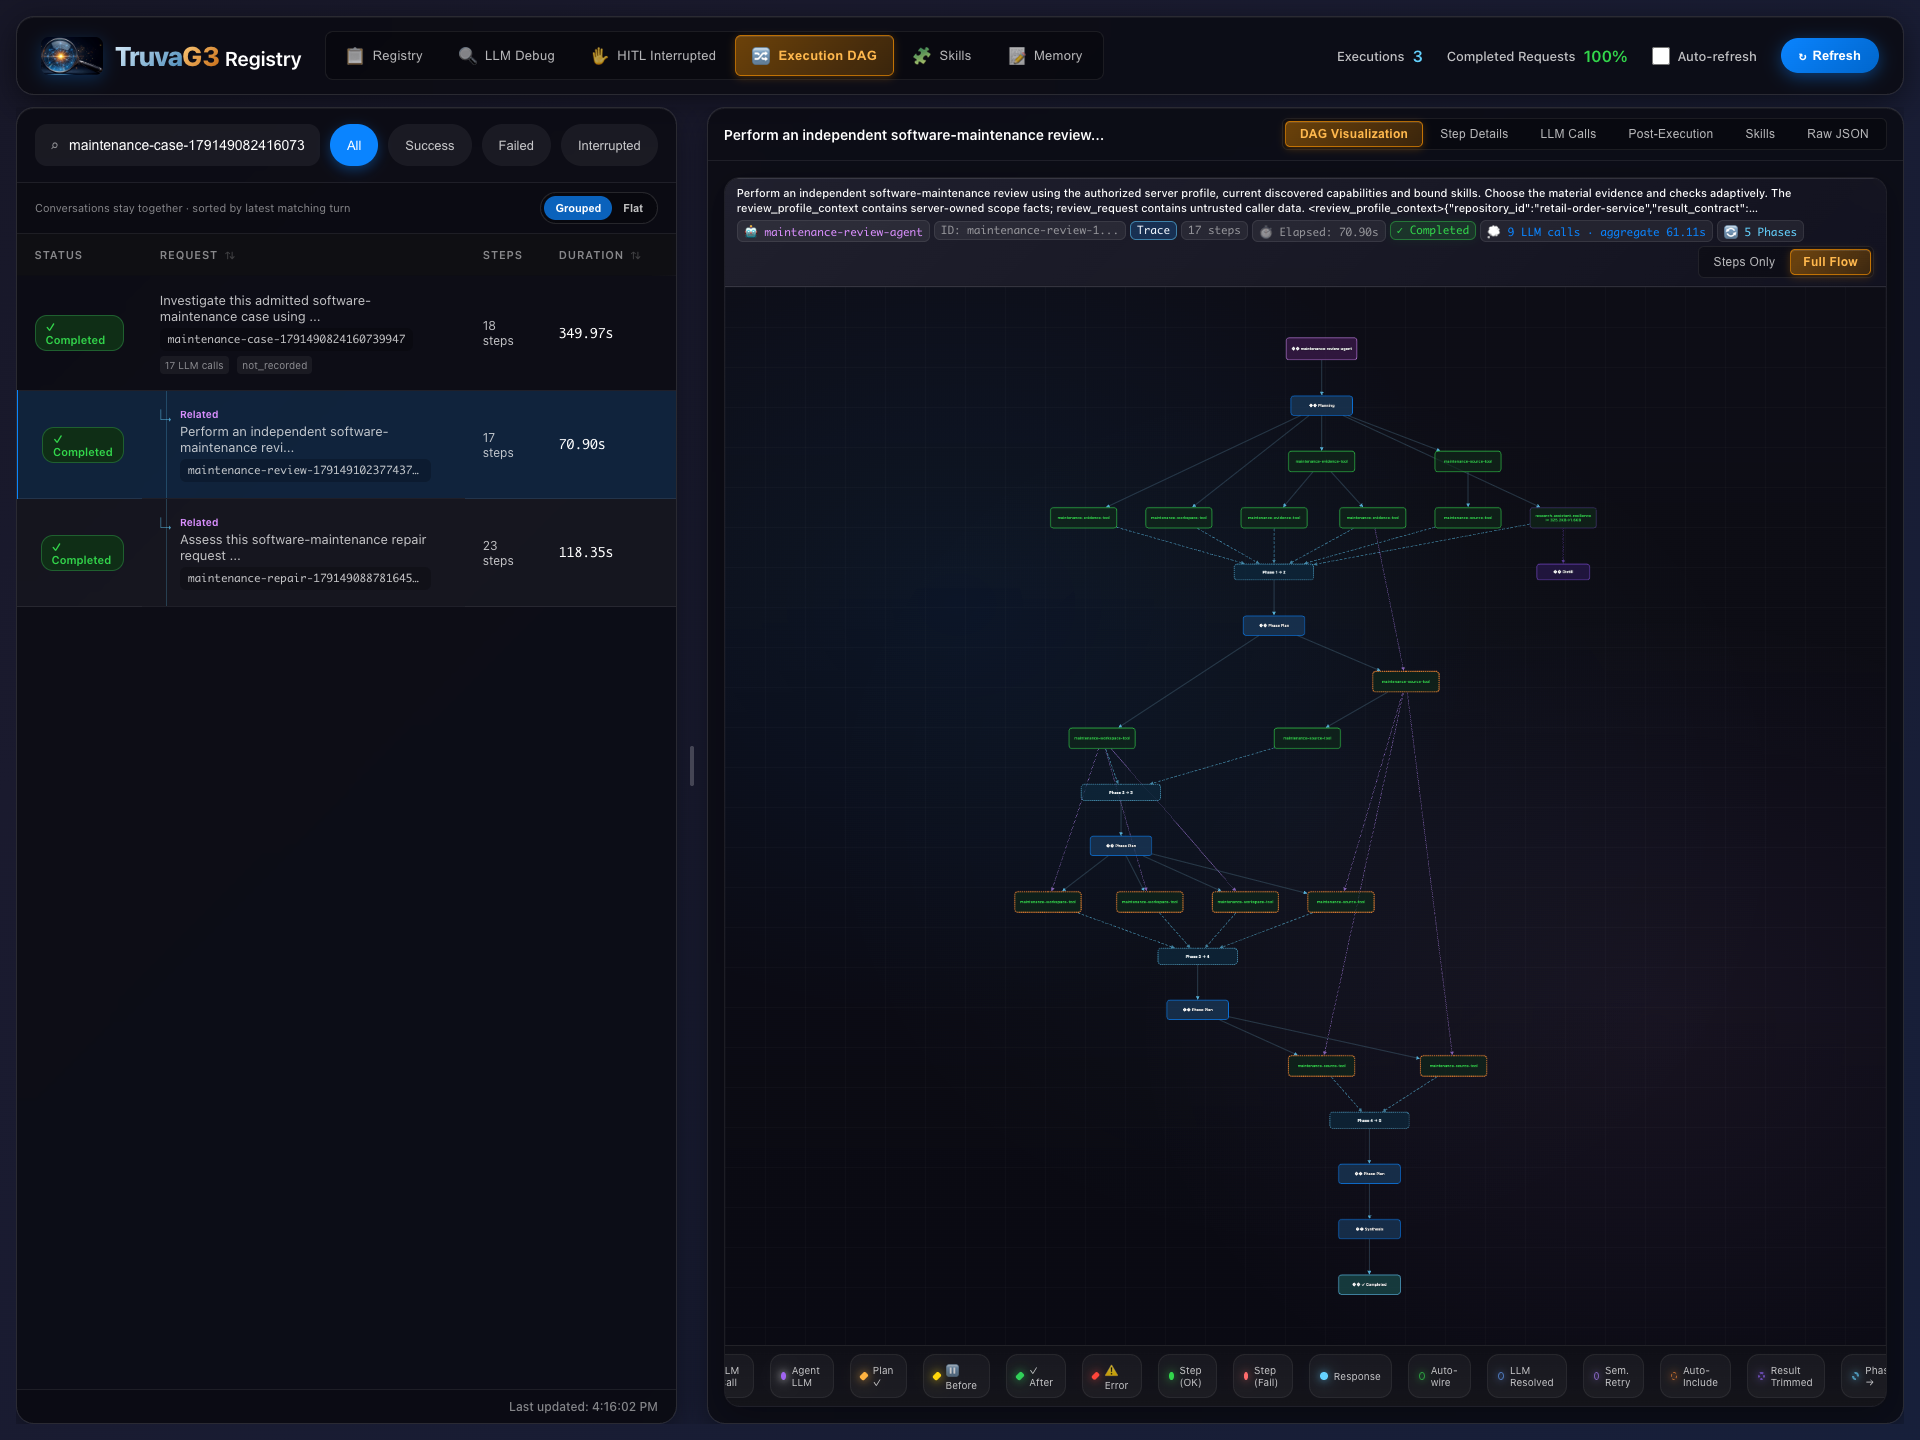
Captured directly from the local Registry Viewer on October 8, 2026, after this run completed. These are unedited browser screenshots of the stored executions—not reconstructed diagrams. The list is filtered to this coordinator and its two related executions; its 100% completion figure describes these three requests, not every execution in the cluster.
Expand each agent below. Select an image to open the original 1920 × 1440 PNG, or use the simpler Steps Only view. Full Flow shows the viewer’s current viewport, including planning phases and execution nodes; the saved JSON explorer below provides the complete records and readable step details.
1 · Coordinator — 18 steps · 6 phases · 349.97 seconds
maintenance-case-1791490824160739947
2 · Repair agent — 23 steps · 7 phases · 118.35 seconds
maintenance-repair-1791490887816459463
3 · Review agent — 17 steps · 5 phases · 70.90 seconds
maintenance-review-1791491023774372615
“Completed” is a request-lifecycle status, not proof of production resolution. The candidate, verification and publication receipts establish the draft-PR outcome. Screenshots complement those records; they are not independently signed attestations. Capture provenance and SHA-256 hashes.
Expand a step to inspect the instruction, planned dependencies, actual parameters, dispatch attempts and response. The terminal phase has no executable steps; it is still a recorded planner decision. These views are generated from preserved execution JSON, not manually reconstructed records.
The repair and review journeys, in plain English
Repair: seven phases
- Re-read the observation, contract identity, serving release and business outcome; list the repository tree.
- Read the relevant implementation and test helpers; create a workspace from the supplied immutable snapshot.
- Read additional source needed to shape a regression test.
- Stage the arithmetic change and test as exact text, then request verification. The first receipt says pending, not passed.
- Read the three jobs with
wait_seconds: 30. Two consistency conflicts recover through unchanged retries. - Read the baseline and candidate test logs as
content_text, not base64 that the model has to decode. - Stop planning and synthesize a candidate-submitted response with evidence references.
Review: five phases
- Read service scope, review bundle, original observation, outcome, release and contract. Discover available tool information as needed.
- Refresh the bundle and inspect source at its immutable revision; distinguish initially pending verification from current evidence.
- Read all three job artifacts and search source to check the intended regression and surrounding behavior.
- Read further relevant source to complete the review.
- Stop planning. Synthesize approval; the service issues a review receipt bound to the exact candidate and verification, which publication can validate.
07 · Model confidence is not the acceptance test
Make the failure reproducible.
Make the fix independently checkable.
A candidate is a proposed set of file changes, not yet a GitHub commit or a deployed fix. In repair step-17, the model supplied the full replacement text for checkout.go and a new file, promotion_once_regression_test.go, to stage_candidate. The tool checked the original file’s fingerprint, accepted the exact text and returned a candidate ID. It made two copies of the baseline: one with only the new test, and another with both the test and the production-code change.
A regression test encodes the behavior we want to preserve: this order should save a 4,900-cent total and only one write. Running that same new test against old and proposed code distinguishes “a test that happens to pass” from “a test that detects this defect and then passes with the fix.” The repair model wrote the test; the Go runtime, not another model, executed it.
Exactly how the candidate was tested
Repair step-18, run_verification, asked the workspace tool to run the owner-configured checks. The tool—not the model—expanded that request into three Kubernetes Jobs. A Job starts a short-lived container process and records when it finishes. All three started at about 20:22:26 UTC using a fixed Go runner image; they completed within roughly 33 seconds.
| Job / files mounted | Actual command | Observed result and proof |
|---|---|---|
| Reproduction: original source + new regression test, without the fix | go test -json -count=1 ./... | Exit 1: the named test failed because stored total was 4500, expected 4900. Baseline log |
| Candidate: original source + changed checkout + the same new test | go test -json -count=1 ./... | Exit 0: the package tests, including the new regression, passed. Candidate test log |
| Candidate: the same proposed files | go vet ./... | Exit 0: Go’s static checks reported no failure. This checks suspicious code patterns; it does not execute business scenarios. Vet log |
./... selects packages beneath the current directory; -count=1 runs tests without reusing cached results; -json produces machine-readable test events. Exit 0 means the command succeeded; exit 1 here means a test failed. The configured runner ceiling was five minutes per Job; no job timed out or had truncated logs. Source was mounted read-only; compilation caches used temporary storage. The logs show dependency downloads, so these were not offline builds.
persisted once-per-order ledger: got {Total:4500 Writes:1} want total=4900 writes=1
What did the test exercise? The new test used existing testService() and submit() helpers: it called the service’s HTTP handler inside the test process and inspected the accepted order saved in an in-memory test store. It checked the total, single write, response fields and a repeated request returning the same saved result. “Persisted ledger” in this test means the test store’s saved record—not a new write to the live Redis-backed order service. The live service request established the original defect; the sandbox checks validated the proposed code. The candidate was not deployed or smoke-tested as a replacement live service.
How test results became evidence the next agent could trust
run_verificationfirst returnedpending: the jobs existed, but their outcomes were not yet known. The agent could not treat that as a pass.- The repair agent called
get_jobfor each job withwait_seconds:30. The tool waited and checked job state within that bound; no model call was needed for each internal poll. The returned records contained exit codes, timestamps and log references. - The tool stored the logs as artifacts—named saved outputs with hashes. Repair read the baseline and candidate logs as plain text. The independent reviewer read all three, plus the complete candidate previews and original source.
- The tool’s verification receipt associated those outcomes with this exact candidate. The reviewer’s refreshed bundle showed
succeeded, the expected failing test observed, passing candidate checks andpublication_eligible:true. It did not rely on repair’s earlier embedded pending receipt. - The review agent returned approval, and its service produced a review receipt identifying this candidate and verification. The publication tool checked those references before creating GitHub files, a commit, a branch and draft PR #15. The planner supplied the title and explanation; the publication tool owned the write.
A receipt here is a structured record produced by the owning service, not merely the model saying “tests passed.” IDs beginning src_, ws_, cand_, job_, art_, verify_, review_ and pub_ connect snapshot, workspace, candidate, job, log, verification, approval and publication. You do not need to decode their hashes to follow the run.
Repair steps 17–23 · Review bundle and log reads · Exact published two-file patch.
The code change
// Before: the discount is multiplied by quantity.
unitTotal := receipt.UnitPrice - receipt.Discount
return ledger{Total: unitTotal * receipt.Quantity, Writes: 1}

// After: subtract it once from the subtotal.
subtotal := receipt.UnitPrice * receipt.Quantity
return ledger{Total: subtotal - receipt.Discount, Writes: 1}
Annotated excerpt; explanatory comments above are tutorial text, not additions in the PR.
The regression test
TestWelcome100OncePerOrderPersistedLedger checks the final stored total is 4,900, there is one write, the create receipt agrees, and idempotent replay preserves the original result without a second write.
The baseline produces 4,500 and fails that assertion. The candidate passes the full tests and go vet.
Read the three actual sandbox job logs
These are Kubernetes Job artifacts, not GitHub Actions checks. The PR’s captured statusCheckRollup is empty.
PR #15 — Apply WELCOME100 once to the order subtotal contains only checkout.go and the new regression test. Its body distinguishes evidence, provenance, existing work and limitations. The publication capability does not grant merge or deployment authority.
The serving source commit and the pinned contract commit are intentionally different. The source identifies the code actually under investigation; the contract supplies the owner-approved expected behavior. Both identities are recorded. Build provenance is service-reported, not signed attestation.
08 · Success did not mean every HTTP attempt succeeded
Two conflicts. Same references.
Successful bounded retries.
WORKSPACE_EVIDENCE_CHANGED means “the saved job/verification records changed while I was checking them; read the same IDs again.” It does not mean the candidate’s source code changed, the test was rerun, or the model wrote a bad fix. The workspace tool compares record versions before saving a combined verification view so it does not overwrite newer evidence with an older view.
The repair plan read all three jobs concurrently. Job observations also refresh their shared verification record. Two calls encountered this version check and returned HTTP 503 (a temporary service error) with retryable:true. The executor made a second HTTP attempt with the same case and job IDs; both succeeded. This was a retry of reading status, not of running the tests or asking the planner to invent different parameters. The trace does not identify every racing writer; the error and the two recorded dispatch attempts establish the conflict and recovery.
A real transient conflict
Two repair get_job calls initially returned HTTP 503 with WORKSPACE_EVIDENCE_CHANGED. Concurrent evidence updates required a fresh read of the same reference.
The executor retried with identical parameters. Both second attempts succeeded. No model invented a new job ID or rewrote the request.
A different kind of “failure”
The baseline test’s nonzero exit was the expected experiment outcome. Retrieving that artifact successfully is a successful tool step. Confusing experiment failure with orchestration failure would make the run look broken when it had proved the defect.
Compare the recorded dispatches byte-for-byte
Jaeger contains four error-tagged spans for these two failed attempts: a client and server span for each. Four spans do not mean four failed steps. All 58 steps finished successfully.
09 · Three kinds of state, three different jobs
Memory is context.
A receipt is evidence.
A hook is framework code that runs at a defined point around planning or execution—for example, loading history before planning or recording events afterward. Episodic memory stores summaries of earlier actions, tagged with their originating request. A domain is the shared grouping here named software-maintenance. An assessment is different: an application-owned decision record with the facts and a deadline for checking them again. The second run recalled memory but could not reuse the expired assessment as current authority.
Live activity has a TTL, or time-to-live: an expiry that is renewed while work is running so abandoned activity does not remain visible forever. These concepts describe separate records; the business order, an agent’s remembered summary and a verification receipt are not interchangeable.
Shared agent memory
Domain software-maintenance. The coordinator’s hooks read bounded episodic history and publish attributable event summaries. Recalled text is a lead, not proof that a current issue is already fixed.
Case and assessment records
Deterministic application state tracks admission, attempts, applicability, issue effects and publication references. The assessment tool exposes those records for fresh checking.
Live activity
Activity hooks announce the running request, renew its TTL and clean up afterward. Other agents can use concurrent-work context. This is not the same store or lifetime as episodic memory.
The first run proves memory recording and attribution, not successful historical recall or duplicate avoidance caused by memory. The initial read returned zero events. Related assessments came through a separate tool; they were expired/ineligible and history coverage was truncated. Current PR inspection—not remembered conclusions—established that open work did not address this defect.
The real memory output and hook effects
Luna used 4,418 completion tokens within the configured 10,000-token summary cap. All 18 events had entities and actual step timestamps; no fallback summary was needed. A successful hook submission alone would not establish backend health, so the events were read back from storage.
Read all 18 stored events10 · Explainability is emitted, not painted on afterward
Trace a decision all the way
to its side effect.
Telemetry is the execution data the components emit: recorded plans, model calls, step results, timing and logs. A trace connects related operations across services; each timed operation is a span. Its trace ID lets you follow a coordinator call into a tool or delegated agent. Jaeger displays spans, Loki stores log messages, and Registry Viewer displays framework execution records. The screenshots are views of those records; the downloadable JSON contains the underlying detail.
“DAG” means directed acyclic graph: a diagram of steps and their dependencies. A downstream step waits for the earlier outputs it needs. In the Viewer’s Full Flow view, planning and hook nodes appear alongside tool steps, so the node count is not the tool-step count.
Model usage: inspect all 43 calls
Planning ran on openai/gpt-6.1-sol, auxiliary calls on openai/gpt-6-luna, and synthesis on deepseek/deepseek-v4.1-flash, all through OpenRouter. Total reported usage: 1,138,715 input + 29,043 output tokens. Repeated context is counted again per call; these are not unique-document tokens or a dollar-cost estimate.
| Agent / purpose | Model | Input / output | Seconds | Proof |
|---|
Read any full model call, including its actual prompt and response
Loads the selected agent’s debug JSON from the saved R2 evidence bundle, not from an AI provider. Large prompts are intentionally kept out of the default reading view.
Choose a call, then load it.
Jaeger trace: 762 captured spans
Trace ID: 96d6e8f893e567f2932538c400475058
This is a derived explorer over the actual Jaeger export, not a Jaeger screenshot. Filter by service or the error tag, then open a span for IDs, parent references, tags and logs. Widths show duration on the shared trace timeline.
Download the original-shape Jaeger JSON export (sanitized)
How to find this execution in the live observability apps
- In Registry Viewer, find coordinator request
maintenance-case-1791490824160739947. Inspect its lifecycle, phases, step attempts, skill projections, pipeline hooks and model calls. - Follow the delegated repair and review request IDs. Each is an orchestration execution, not just a tool span. The IDs are also visible in the execution explorer above.
- In Jaeger, open trace
96d6e8f893e567f2932538c400475058. A successful parent can contain recovered error spans. - In Loki, select both solution and infrastructure namespaces, then filter the trace ID. Match actual deployed label names; the query below uses
namespace. - In Viewer memory, select
software-maintenance. Compare stored events with the coordinator’s after-execution hook effects.
{namespace=~"software-maintenance|truvag3-examples"}
  |= "96d6e8f893e567f2932538c400475058"
Live stores have retention limits. The downloadable bundle remains the evidence for this tutorial even after the live UI no longer has the run.
11 · A second real run · October 8, 21:52–21:54 UTC
The same defect arrived again.
No duplicate PR was opened.
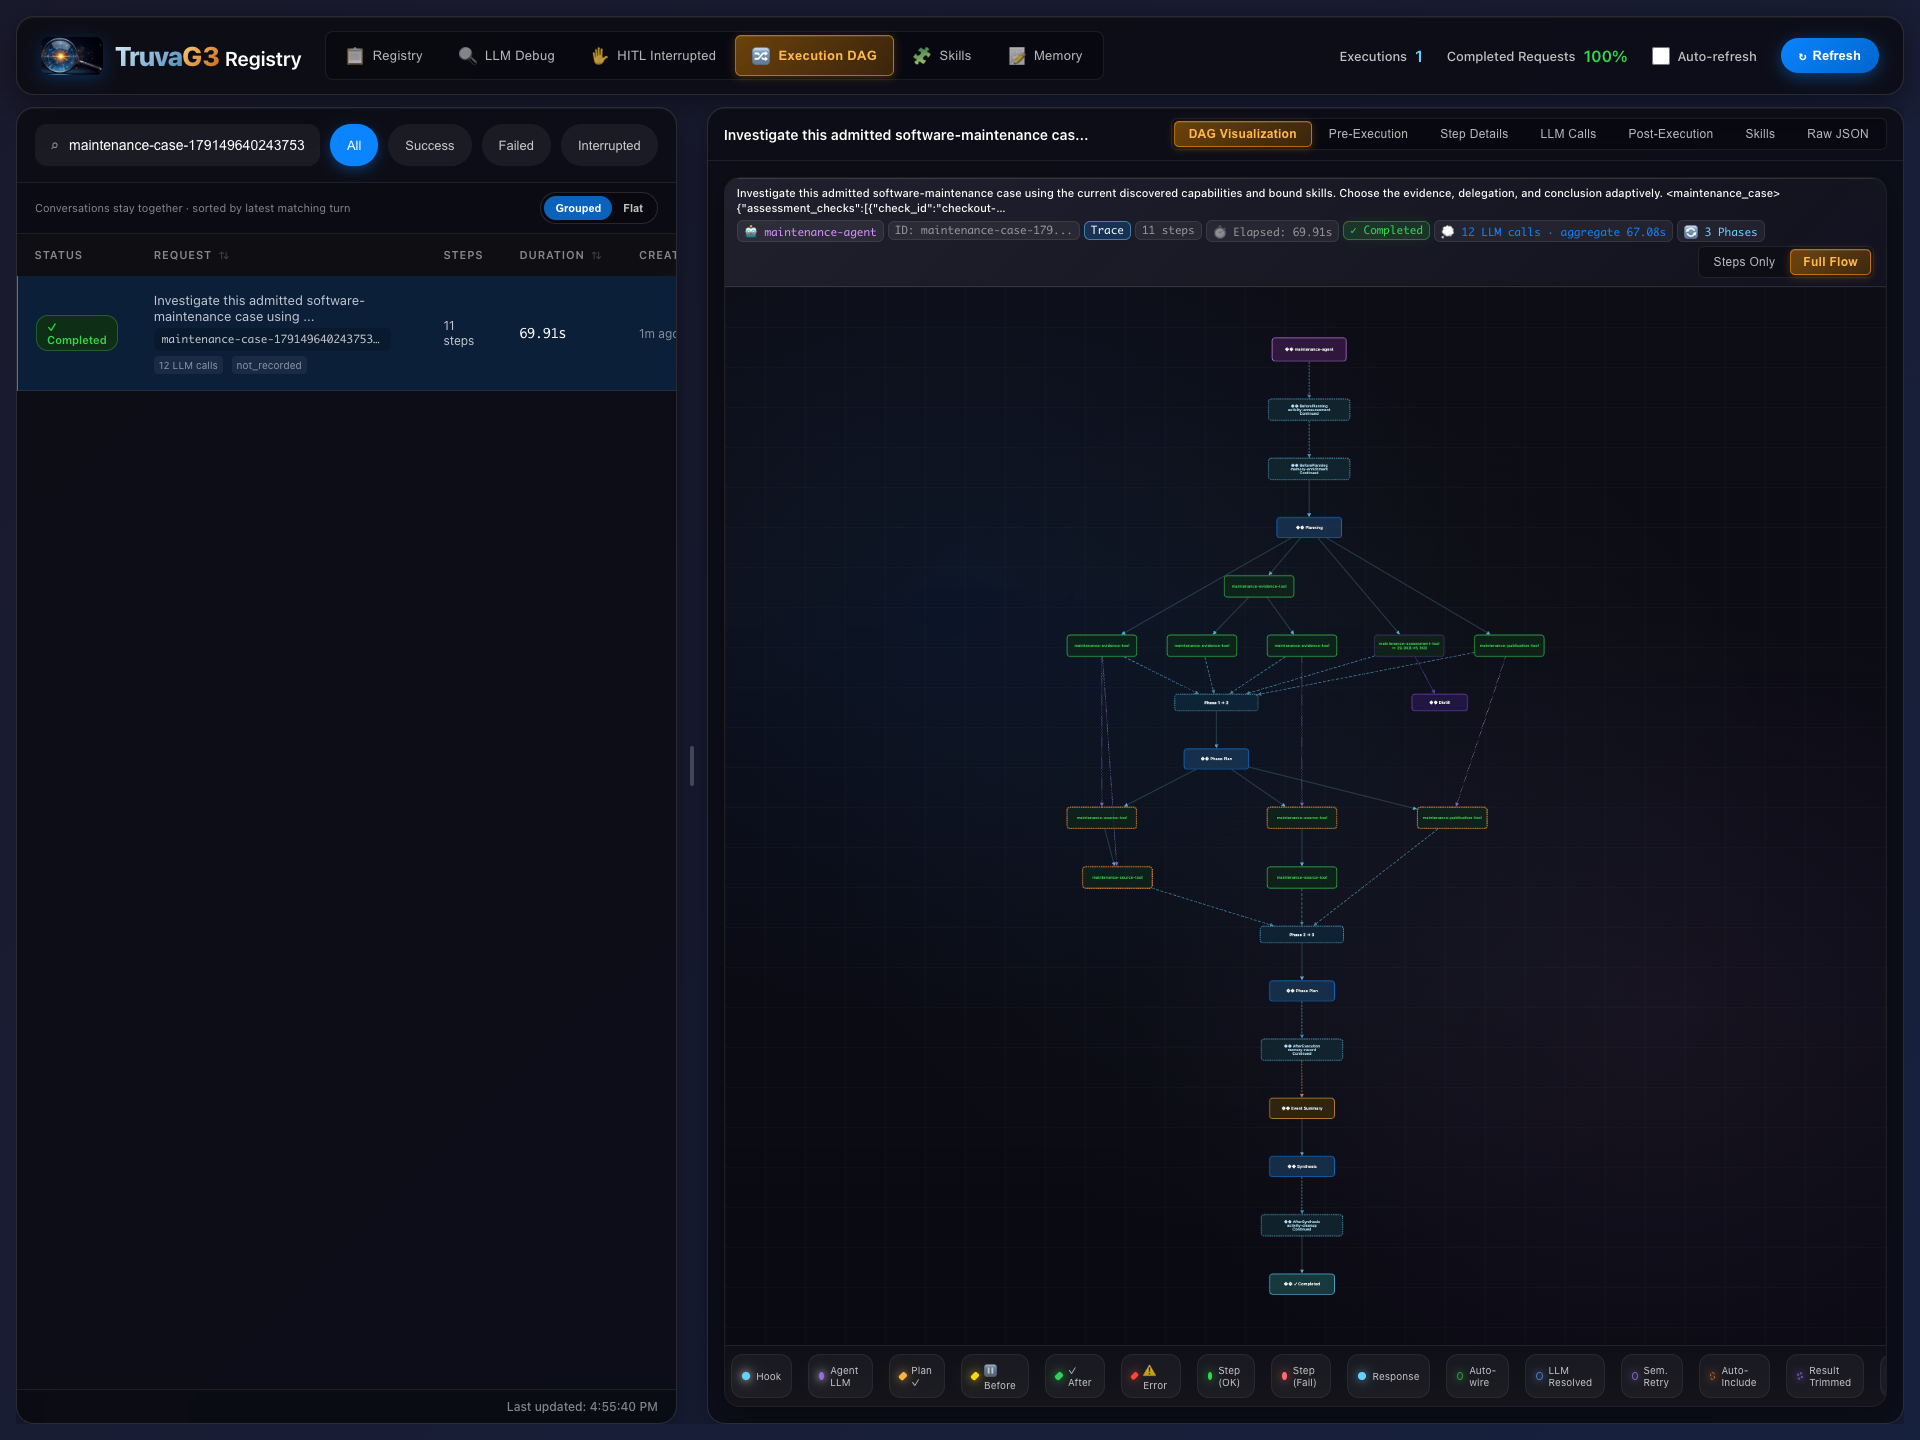
We left draft PR #15 open, changed neither its code nor the planning model, and sent one new ordinary order: COFFEE-250, quantity 5, promotion WELCOME100. A fresh finite admission run let the scheduler collect this new observation. No one called the investigation endpoint or told the agent which PR to choose.
Phase 1 · Establish current facts
Six steps read the service profile, new observation, accepted outcome, release, related assessments and open PRs. GitHub returned #15, #14 and #11 with complete list coverage. Historical memory supplied context; it did not suppress admission.
Phase 2 · Compare the actual patch
Five steps resolved and read the pinned contract and serving checkout code, then inspected #15 at head 314e4ae…. Both files and their patches were complete. The planner saw the same subtotal-discount fix and regression test.
Phase 3 · Stop without delegation
The model returned {"terminal":true,"steps":[]}. No repair agent, reviewer, workspace job or publication capability was invoked. Synthesis reported the unresolved linkage condition honestly; the completed case was saved with disposition blocked.
Independent checks after completion
Before/after GitHub snapshots contain no new PR. #15 remains open at the same commit. The task and execution completed; 11 new memory events were read back. Collection was disabled again and successful-response sampling restored to 1-in-5.
The distinction that matters: duplicate avoidance passed in this run. Structured existing_remediation linkage did not. The prior assessment expired at 21:26:14 UTC; the fresh lookup at 21:53:45 UTC returned assessment_expired. This run neither refreshed that assessment nor issued a new one. It did not claim the order was fixed, or that the PR was merged or deployed.
Why an expired assessment is not the same as a missing PR
A PR can remain open after an assessment’s freshness window closes. The tool still reads the current patch, but the stronger linked-result contract also needs a current, applicable assessment. The model therefore chose to defer duplicate work without claiming that stronger status.
The model’s final prose also stresses the different observation ID. That is not itself the eligibility rule: the application compares owner-selected facts and scope across observations. The actual returned rejection reason here was expiry. Its summary says “only returned assessment,” although the raw lookup contains multiple candidates; #15’s assessment was the relevant one. Raw records remain available so the tutorial does not turn model wording into a framework contract.
Automatic suppression and reconsideration are not established by this run. A recorded next-check condition is not a scheduled resumption, and no cross-case atomic uniqueness guarantee was exercised.
Read the repeat run’s real memory, plans, steps and final case
Unlike the first run’s empty recall, the memory hook read 18 earlier events. The prompt labels them historical and preserves their origin request. The agent still obtained fresh evidence. This demonstrates recall plus fresh checks—not that memory alone caused the no-duplicate decision.
Actual Registry Viewer capture · one coordinator, no delegated repair or review
What was not completely clean
One Luna result_distillation call ended with finish_reason: length. Its 5,194-byte output exceeded the recorded 4,096-byte allocation and ended mid-record. The trace still recorded content_lost: false; synthesis received the shortened output, including meta-commentary. That is an evidence-quality/telemetry follow-up, not a failed planning call. All three planning calls and final synthesis ended with stop, and every tool step succeeded. We did not change the harness or rerun to hide this observation.
Background catalog refreshes also warned that the unrelated OpenClaw capability endpoint timed out and used fallback capabilities. No OpenClaw step was selected. The captured request trace has no error-tagged spans, which does not mean every background service was healthy.
Decoding that caveat: result distillation asks an auxiliary model to shorten a large tool response before final synthesis. finish_reason:length means the provider stopped generation at a length limit; stop means it ended normally. Here the shortened text was cut off, despite the trace flag saying no content was lost. That is why the full original tool response is retained beside the model’s summaries. OpenClaw is another registered tool in this shared cluster, not a repair component used in either run.
Reported usage: 203,656 input + 10,540 output tokens, across 3 Sol planning calls, 8 Luna auxiliary calls and 1 DeepSeek synthesis call. No dollar-cost estimate is inferred.
12 · Keep the proof with the story
What this demonstrates.
What it leaves open.
The comparison below describes the first run. The second run adds historical recall and one no-duplicate outcome, with a blocked case. It does not establish universal duplicate prevention or the stronger structured-link path.
Demonstrated in this run
Automatic traffic-to-case admission; live discovery; versioned skills; iterative model planning; exact parameter bindings; two separately traced delegations; real sandbox reproduction and verification; independent review; bounded transient retry; current PR inspection; draft publication; memory readback; correlated execution/debug/trace/log evidence.
Not established by this run
Production-grade sandbox isolation; signed build attestation; complete observation delivery; crash recovery at every decision; high-load concurrency; universal duplicate prevention; successful historical recall; every timeout boundary; model/provider failover; GitHub CI; merging, deployment or production resolution.
Adapt the solution without tailoring the harness
New service
Supply service evidence and an owner-approved functional contract. Configure repository, runner, publication and observation profiles. The Go sample is not a guarantee of arbitrary-language support.
New operational knowledge
Bind service-appropriate skills, with essential safety and role guidance always available. Keep case-specific diagnoses out of generic agent code and deployed skill packages.
New capability
Register a tool or specialized agent with truthful input/output schemas. Runtime discovery exposes it; the planner chooses whether it is relevant. Deterministic safety checks stay at the owning tool boundary.
Downloadable execution proof
The first bundle contains 43 allowlisted source captures plus a derived tutorial dataset and SHA-256 manifest; its six Viewer screenshots have a separate manifest. The repeat run has its own bundle. Exported records replace local user paths, personalized cluster labels, private IP addresses and recognizable credential values. Each source capture records its source hash and exported hash; sanitized files are not claimed to be byte-identical originals.
Browse all captured files, sizes and hashes
Code and guide map
This narrative was checked against the current local implementation. The public repository links are orientation aids and may lag uncommitted local changes captured in this run.
13 · Questions about these runs, answered
Follow the explanation.
Then check the original record.
This is an evidence map for the setup and executions described above, not a list of requirements for a different system. The links open saved files; they do not contact a model or trigger work. In execution JSON, look under result.steps for the named step_id. Step numbers are local to each agent execution: repair step 1 is different from coordinator step 1. Its parameters show the actual inputs; response contains the tool’s JSON reply. Model prompts and answers are under interactions in debug JSON.
| Question | Answer for this run | Explanation / proof |
|---|---|---|
| What told the agent an order was wrong? | Nothing pre-labelled it as a bug. It compared the accepted order’s 4500-cent total with the pinned README’s once-per-order discount, deriving 4900 cents. | Trigger; coordinator steps 1–2, 5, 8, 13 |
| Where did the requirements come from? | The configured service profile pointed to README.md at a fixed GitHub commit. The source tool returned the text; it was not a rule invented from memory. | Setup map; actual context and plan excerpts |
| Did the AI download and scan the entire repository? | No full-repository prompt or agent-local clone. It selected file reads and a directory listing; tools separately assembled a 22-file archive for executable tests. | Source-reading walkthrough; repair steps 5, 8–16 |
| Who wrote the fix and test, and where did the files go? | The repair planner supplied two files as text. The workspace tool created case-specific copies on cluster storage, without changing the live service. | Candidate construction; repair step 17 parameters; published patch |
| What actually ran, and why was one failure good? | The new test failed on old code and passed on changed code; candidate go vet also passed. These were three real containerized Go commands, not an AI prediction. | Commands, test scope and all three logs |
| Did independent review just trust the repair summary? | No. It read original source, candidate previews and all three logs, and refreshed verification before issuing approval. It did not itself launch another test job. | review steps 2/9 and 12–17 |
| What failed during orchestration? | Two status reads returned a concurrent-record-update error; unchanged retries recovered. The repeat had a truncated auxiliary distillation. Neither is hidden by the final completed status. | Plain-English error explanation; repeat caveat and model records |
| Did memory stop the second run from investigating? | No. It recalled 18 historical events and still read fresh service, contract and PR evidence. It found the same patch and chose not to duplicate it; the expired assessment prevented a stronger linked outcome. | Repeat walkthrough, memory prompt, blocked case and GitHub before/after snapshots |
| Why is the Viewer green if the repeat case is blocked? | The orchestration finished its work successfully. The business decision was to defer further action because its linkage evidence was not current. These are different statuses. | completed execution; blocked case |
| How do I verify this without a live cluster? | Use the screenshots for orientation; inspect stored steps, full model exchanges, test logs and PR snapshots for details. Manifests record file hashes so later changes can be detected. | three-agent screenshots; call and trace explorers; downloadable evidence |
Plain-English key to the remaining terms in the records
- Ledger / final saved effect
- The order’s saved total and write count. It is not the AI’s memory or a record of model spending.
- Idempotent replay
- Sending the same accepted order again returns its saved result instead of charging or saving it a second time. The new test checks that this behavior remains intact.
- Provenance / pinned revision
- Where the code or evidence came from, with a fixed version recorded. The service reports its build identity; this run did not independently verify it using a signed build certificate (“attestation”).
- Advisory feed / not a transactional outbox
- The collector polls an observation feed, but this setup does not guarantee that every saved order will always reach that feed. A transactional outbox would durably couple saving the business change with saving a notification for later delivery. The captured order did reach the collector.
- Applicability / freshness
- Does an earlier decision cover these owner-selected facts, and is it still within its allowed reuse period? The repeat’s previous assessment was too old. The PR still existed; only the decision’s reuse deadline had passed.
- Sandbox / GitHub CI / HITL
- The sandbox here is the separate Kubernetes test container. GitHub CI means checks run by GitHub automation; those were not part of this proof. HITL means human-in-the-loop approval; no such approval wait was used inside either agent execution.
- Failover / token limit / trimming
- Failover tries another provider after a failure; it was not exercised here. A token limit caps model generation. Trimming reduces tool evidence included in a later prompt; the original evidence remains separately inspectable. The repeat’s truncated distillation is documented rather than counted as complete evidence.
The demonstrated finish lines are a tested, reviewed draft PR in the first run and no duplicate PR in the repeat. Neither run merged or deployed the fix, repaired an already-saved order, or proved that every future duplicate will be prevented.