TruvaG3: An Introduction to the Microagents Framework
A guided tour of TruvaG3 — why it exists, how the architecture works in practice, what the framework ships with, and how to decide whether it fits your situation. Written for engineers and architects who already operate Kubernetes platforms.
Contents
- Two problems, one framework
- Why TruvaG3 exists
- How the architecture works, briefly
- What TruvaG3 ships with
- 1. Component runtime
- 2. Runtime discovery
- 3. Self-describing capability contracts
- 4. Observability
- 5. Vendor-agnostic AI provider layer
- 6. Orchestration
- 7. Reliability and error recovery
- 8. Async tasks and scheduling
- 9. Human-in-the-loop
- 10. Memory and context
- 11. Chat agent reference pattern
- 12. Security and request propagation
- 13. Extension points
- What it looks like in code
- Run it on a laptop
- Where to go next
Two problems, one framework
Two things make most agent platforms difficult to run in production.
The first is architectural. Most agent frameworks ask the developer to name every tool and every peer agent in source code before the program starts. After that, the framework does not look outside that fixed list. Adding a tool means changing source code and redeploying the agent. Adding a new agent that other agents need to reach means rewriting the routing layer that decides who talks to whom. This works for a demo. It does not match how distributed systems are usually built.
The second is operational. Even when an agent framework gets the architecture right, it often brings its own runtime: its own orchestrator process, a hosted control plane, a vendor-specific workflow engine, or all three. For a platform team that already runs a working Kubernetes environment, that is not a feature — it is a new system to learn, scale, secure, and pay for. The team has to either accept a parallel operating model for agent workloads, or rebuild parts of the platform they already trust.
TruvaG3 is a Go framework that takes a different position on both counts. The architecture is the microagents reference described in a separate article — capabilities registered into a shared registry at runtime, peers addressed by logical name, orchestration inside each agent, decentralized coordination between participants. The runtime is ordinary Kubernetes: Deployments, Services, ConfigMaps, Secrets, ingress, service mesh, autoscaling, OpenTelemetry. The framework adds the agent-specific pieces — discovery, an LLM client, an orchestrator, resilience and memory primitives — and does not require anything else.
This article walks through both halves. Read it end to end, or use the contents to jump directly to the areas relevant to you; sections can be skipped without losing the thread.
Why TruvaG3 exists
The architectural reason
The companion article on the microagents architecture argues the case in detail, with primary-source evidence from production teams. The short version follows.
Most agent frameworks today share one wiring pattern. The developer builds an agent, gives it a list of tools, and starts a loop. If a second agent is needed, the developer either wires it into the first agent as another callable, or places both agents inside a higher-level orchestrator that decides whose turn it is. In every case, the set of participants is fixed in source code before the program runs.
Production teams report that this pattern hits real limits. Anthropic's engineering account of their multi-agent Research feature describes synchronous lead-subagent coordination as a bottleneck — the lead agent cannot steer subagents, subagents cannot coordinate, and the whole system can block on one slow subagent. Microsoft Research, writing about Magentic-One, names the static composition itself as a limitation: "Magentic-One's composition is fixed to a common set of five agents... When agents are not needed, they simply serve as a distraction to the Orchestrator... Conversely, when extra expertise might be needed, it is simply unavailable. We can easily imagine an alternative approach where agents are added or removed dynamically, based on the task need." The fix the Magentic-One authors describe — agents added or removed dynamically — is exactly the microagents approach.
The microagents architecture has five defining properties:
- Specialized and independently deployable. Agents and tools run in their own processes, with their own release cadence and ownership.
- Runtime registration into a shared registry. Capabilities are advertised at runtime, not wired into a caller's source code.
- Capability-based addressing. Callers ask for a logical name, such as
geocode_location; the framework resolves the name to whichever endpoint currently serves it. - Independently scalable, replaceable, and migratable. Callers continue to look up participants by the same name; the registry tracks where the name currently points.
- Decentralized coordination. Each peer drives its own work. The registry mediates discovery, not control.
Two coordination layers fall out of this design. Inside each agent, a single orchestrator runs the request: it plans against the current capability catalog, executes the plan as a directed acyclic graph (DAG) with parallelism where dependencies allow, and synthesizes the response. It can return to planning when fresh data unlocks the next phase. Between participants, no such orchestrator exists. Each agent reads the registry, resolves capabilities to endpoints, and calls peers directly over HTTP. Nothing in the middle routes, sequences, or coordinates.
The result: tools and agents look the same to the LLM. A capability is a capability. Adding a new participant is purely additive — no central manifest changes, no caller code changes, no redeploys elsewhere. Within one refresh cycle of the registry, the new participant is visible to every existing caller.
One architectural property underpins everything that follows: the wire protocol between agents and tools is plain HTTP/REST. The shared registry — Redis or Valkey by default; pluggable — sits behind the discovery interface, while participants expose contracts and call peers over familiar HTTP surfaces. The architecture composes established distributed-systems primitives rather than introducing a new agent-specific wire protocol. The next subsection covers what that choice means operationally.
The operational reason
The architectural argument is necessary but not sufficient. Plenty of agent frameworks have interesting architectures and still struggle to land in enterprise environments. The reason is rarely the architecture itself; it is the operational footprint that comes with it.
Most popular agent frameworks expect one or more of the following:
- A managed SaaS control plane that hosts the orchestration logic and stores execution state.
- A new runtime process — a workflow engine, an agent runtime daemon, a vendor-specific scheduler — that platform teams need to deploy, monitor, scale, and upgrade separately from the rest of the system.
- A vendor-specific data plane: a proprietary message bus, a custom storage layer, or a control plane database that does not fit into the existing observability and backup strategy.
- A different operational model for failure handling, secrets management, deployments, and access control.
For a team that has spent years building a Kubernetes platform — Deployments, Services, Ingress, NetworkPolicies, mTLS, ConfigMaps, Secrets, HPA, an OpenTelemetry pipeline, a CI/CD path, on-call rotations — none of this is welcome. It is a parallel operating model for agent workloads. It also has real consequences: regulated and air-gapped deployments cannot use a SaaS control plane; namespace-based team isolation does not fit a single global orchestrator; on-call rotations have to learn a new failure mode set.
TruvaG3 takes the opposite position. Every agent and every tool is an ordinary HTTP service, deployed and operated the way any other workload in the cluster is deployed and operated. Specifically:
- Agents and tools are Deployments behind Services. The framework registers the Kubernetes Service DNS name, not pod IPs. The cluster's own Service load-balances calls across replicas. Horizontal Pod Autoscaler scales them like any other workload.
- Configuration is through environment variables and ConfigMaps. Secrets are managed through Kubernetes Secrets.
- Observability is native OpenTelemetry. Traces and metrics flow to the existing OTLP-compatible backend — Prometheus, Jaeger, Grafana, Loki, Tempo, or a commercial equivalent. No adapters.
- The default registry is Redis or Valkey. Most teams already operate one or both. The interface is pluggable, so etcd, Consul, or a custom backend can replace it.
- There is no required SaaS control plane. Self-hosted is the default. Air-gapped operation is supported, via namespaces.
One of these choices is worth pulling out, because it changes the operational story for the whole framework.
The component-facing interface is HTTP/REST. Runtime calls between agents and tools are HTTP. Each component exposes its capability contract over HTTP at standard paths: the catalog at /api/capabilities, the individual capability endpoints at /api/capabilities/{name}, the auto-generated JSON Schema at /api/capabilities/{name}/schema, and the full OpenAPI document at /openapi.json. Health checks are HTTP. Telemetry export is OTLP over HTTP. There is no proprietary wire format and no sidecar to inject. Agents look up peers through the shared registry (Redis or Valkey by default; pluggable), but everything visible on the network between participants — runtime, contract, observability — is the same REST surface that any well-built microservice in your cluster already presents.
This is a structural property, not a compatibility claim. Because the protocol is the one your platform team already operates, every piece of infrastructure that already works on your REST services works on TruvaG3 components in the same way: API gateways (Kong, Ambassador, Nginx), service meshes (Istio, Linkerd), ingress controllers, network policies, identity providers, mTLS, OAuth and JWT validation, RBAC, audit logging, rate limiters, web application firewalls, monitoring, API governance tools, OpenAPI consumers (Swagger UI, Postman, code generators). Nothing has to be re-built or re-secured for agent workloads. Security and authentication and authorization patterns the team has already standardized on apply by default, because the thing being secured is just an HTTP service.
That combination is the point: the microagents architecture without a parallel operating model. TruvaG3 assumes architectural flexibility and operational familiarity both matter.
How the architecture works, briefly
This section is a compressed restatement of the architecture, enough to follow the rest of the article. For the full treatment — including production-team citations, the wiring problem in detail, and two captured execution traces from a running cluster — see the architecture article.
The architecture is built around a single primitive: a capability registry. Every participant publishes the capabilities it offers into a shared index, each identified by a logical name. These names are runtime facts about the deployment; they are not configuration carried in any caller's code, and no participant references a peer's capability by name in its own source. When a request needs to be planned, the framework hands the registry's current contents to the LLM as the planning catalog. The LLM picks capabilities; the framework dispatches each chosen step to the address the registry currently lists for that name.
A registration carries more than a name. It also carries:
- The network address (a Kubernetes Service DNS name, in cluster deployments) and the endpoint path.
- A natural-language description, so the LLM can decide whether a capability is relevant to a request.
- Structured field hints for inputs and outputs: name, type, example value, short description. These hints let the LLM generate correct JSON and let the framework validate it.
- An optional full JSON Schema for deployments that want stricter validation.
Registrations are leases kept alive by heartbeats. If a participant crashes or loses network connectivity, its entry expires automatically; the runtime-discovery section covers the timing and failure trade-off.
Three roles run on top of the registry:
| Role | Registers capabilities? | Discovers peers? | Has internal orchestrator? |
|---|---|---|---|
| Tool | Yes | No | No — passive HTTP endpoint |
| Agent | Yes | Yes | Yes — runs a plan-execute-synthesize loop |
| Registry | — | — | No — passive index |
The difference between tools and agents matters, and TruvaG3 enforces it at compile time. A Registry interface lets a component register but not discover. A Discovery interface extends Registry with the lookup methods. Tools satisfy Registry only. Agents satisfy Discovery. A tool cannot call discovery methods, because those methods do not exist on its interface. The check happens before the code runs:
// Tools can only register themselves (passive components)
type Registry interface {
    Register(ctx context.Context, info *ServiceInfo) error
    UpdateHealth(ctx context.Context, id string, status HealthStatus) error
    Unregister(ctx context.Context, id string) error
    // No discovery methods — tools cannot find other components
}

// Agents can both register and discover (active orchestrators)
type Discovery interface {
    Registry  // Embeds registration capability
    Discover(ctx context.Context, filter DiscoveryFilter) ([]*ServiceInfo, error)
    FindService(ctx context.Context, serviceName string) ([]*ServiceInfo, error)
    FindByCapability(ctx context.Context, capability string) ([]*ServiceInfo, error)
}
In most frameworks the tool/agent boundary is a convention. In TruvaG3 it is a property the type system checks.
What TruvaG3 ships with
The framework is intentionally modular. The core module is the only required dependency; everything else is opt-in. Six modules ship in the box:
core— the framework's interfaces, the base implementations for tools and agents, configuration loading, the pluggable service registry, and the auto-generated HTTP surface. Every component depends on it.ai— provider-neutral LLM clients, enterprise routing, failover chains, and embeddings. Add it when an agent needs to call an LLM.orchestration— the per-agent reasoning loop: planning, DAG execution, reusable agent skills, streaming, approvals, async and scheduled work. Add it when an agent coordinates multi-step work.memory— shared agent memory and per-user memory. Add it when agents need state across requests.resilience— circuit breakers, retry with exponential backoff, panic recovery. Add it for fault isolation between components.telemetry— OpenTelemetry-native metrics, traces, and structured logging. Cross-cutting; the other modules wire it in through dependency injection.
core is a hard dependency. The four modules above it are additive — an agent that never calls an LLM never imports ai, a tool-only deployment never imports memory — so what you operate is what you actually use. telemetry sits apart because it is not a layer in the stack: the other modules take it by injection.What follows is a tour of what each module changes about building and running an agent. It is not a reference, and it does not try to be. Every subsection ends with a link to the corresponding reference guide, where the option names, configuration keys, metric names, and interface signatures live.
1. Component runtime
Behind every TruvaG3 component — tool or agent — is a small runtime that handles the work of being a service: starting an HTTP server, wiring panic-recovery and logging middleware, registering capabilities with the discovery layer, propagating loggers and telemetry into handlers, refreshing heartbeats, and shutting down cleanly on a termination signal. The developer writes the business logic. The framework supplies the rest.
A component starts with core.NewFramework(component, opts...), and every operational property is a functional option — a name, a port, a namespace label, a registry connection, CORS for browser-facing components, middleware, OpenAPI generation. Most have a matching TRUVAG3_* environment variable, so one binary runs in many environments without recompiling, and precedence is predictable: explicit code wins, then environment, then framework defaults. Panic recovery and request logging are wired for you; distributed tracing and anything application-specific — auth, rate limiting, audit — go in through the middleware option.
Every component gets the same endpoints mounted for free. GET /health is a Kubernetes-ready liveness probe. GET /api/capabilities is the component's catalog. Each registered capability gets its own POST endpoint, and one that declares an input summary also gets an auto-generated JSON Schema — no HTTP handler to write in either case. GET /openapi.json serves the full document once you turn it on. Section 3 covers what those contracts contain.
Dependencies arrive by injection rather than through globals, and what a component receives depends on what it is. Tools get a registry handle that can register but not look anything up, plus a logger, telemetry, and an optional AI client. Agents get full discovery and memory as well. Tools deliberately have no memory field: caching a tool's own responses is a tool-local concern with tool-specific eviction rules, and the framework does not pretend otherwise. Tests substitute the in-memory implementations that ship alongside.
Long-running background work — a memory sweeper, a metric reporter, a scheduled-task worker — registers as a runnable, which the framework starts before the HTTP server, hands a cancellation context, and stops during shutdown.
Working examples. weather-tool-v2 and country-info-tool show what a focused tool looks like; travel-chat-agent shows the same runtime carrying the full feature set. my-tool is a coding-agent scaffold for starting a new tool from scratch.
Deep dive: core/README.md · Tool Development Guide · Agent Development Guide.
2. Runtime discovery
Discovery is the primitive that makes the rest of the architecture possible: agents find tools and other agents by what they can do, not by address. Deploy a new tool and every existing agent can use it within seconds — no agent code change, no redeploy. Remove it and it disappears just as fast.
One registry holds tools and agents on equal footing, each publishing capabilities that anything else can look up by name, all behind a single Go interface. Redis — or Valkey, which speaks the same protocol — is the default backend, because most platforms already run one for sessions, caching, or queuing. An in-memory implementation ships for tests, and another store can be plugged in behind the same interface. Switching backends is a deployment change, not an application change.
The workhorse lookup answers "give me every component that can do this," and it is the call the orchestrator makes once the LLM has chosen a capability. Two others answer "give me this specific component, whatever it does" and "give me everything matching this filter."
Liveness is the registration. Every entry carries a 30-second TTL, and each component refreshes its own every 15 seconds with jitter. A component that crashes or loses the network simply stops refreshing, and its entry expires within one window. There is no separate health-check system to keep in sync and no orphaned entries to clean up.
Replicas just work. In Kubernetes the framework registers the Service DNS name, not pod IPs, so a discovered call goes through the cluster's own Service and load-balances across healthy pods. The Horizontal Pod Autoscaler can take a tool from one replica to fifty without touching a registry entry, and rolling updates, restarts, and node failures never reach the discovery layer at all. Outside Kubernetes the framework falls back to pod-scoped addresses — same registry shape, different default.
Because the framework advertises nothing but a Service DNS name, transparent service meshes such as Istio and Linkerd work without special configuration. The mesh handles mTLS, traffic policy, and retries; the framework handles capability discovery at the application layer. The two are orthogonal — neither needs to know the other exists.
Registration, lookup, heartbeat, and result-count metrics all export over OTLP, so the registry's own health shows up in the backend you already run. The bundled chat agents additionally expose a GET /discover capability returning the live registry snapshot, and the Registry Viewer renders the same data as a browsable dashboard — the fastest answer to "what does my system currently look like?"
Deep dive: Auto-Discovery Guide.
3. Self-describing capability contracts
How does an agent know what JSON to send to a tool? In most frameworks the agent's source holds a hand-written wrapper per tool — signature, field names, types — that has to stay in sync with the tool's real API. When the tool changes, the wrapper drifts, and the agent starts failing in ways that are hard to debug. TruvaG3 moves the contract to the other end: it is part of the registration, not part of the caller.
A registered capability carries three layers, each more precise than the last. A natural-language description tells the LLM what the capability does and whether it is relevant at all. Structured field hints — name, type, example value, and a short description for every input and output field — tell it the field is called location, not city, and give it concrete guidance for constructing the payload. An optional JSON Schema, generated automatically from those hints, lets the orchestrator validate a payload before sending it and catch the remaining edge cases. The first layer ships by default; the second is the baseline for any production tool; the third is opt-in for cases where validation has to be exact.
All of it is reachable over plain HTTP — the catalog, the per-capability endpoints, the generated schemas, and a complete OpenAPI document that drops straight into Swagger UI, Postman, code generators, and API gateways. Nothing here comes from a documentation pipeline that can fall behind the code, and there is no client SDK with hardcoded signatures to version. The registration is the documentation.
Output schemas catch a class of LLM mistake most planners miss. Systems that describe only inputs leave output structure implicit. TruvaG3 publishes output hints too, so when a multi-step plan references upstream data — {{step-1.response.data.products}} — the orchestrator can check that products is a field step 1 actually returns. A hallucinated field is rejected before any step runs and the planner is asked for a corrected plan. Field-level hallucination becomes a recoverable retry instead of a confusing runtime error.
Working example. weather-tool-v2 ships all three layers: a description, field hints declaring lat and lon as required numbers with realistic examples, a generated schema, and separate input and output components in its OpenAPI document.
Deep dive: Tool Schema Discovery Guide.
4. Observability
The depth of telemetry is one of the framework's more distinctive properties. Instrumentation does not stop at the agent boundary — it runs inside the orchestrator, the AI client, the discovery layer, the memory subsystem, the pipeline hooks, and the prompt builder. A single user request crossing three services typically produces more than 40 spans across roughly 28 distinct operation types.
W3C TraceContext propagation reassembles a request spanning several agents and tools into one trace in any OTLP-compatible backend. The spans carry what you want when something is wrong and little else: for AI calls, the provider, semantic model, token counts, finish reason, and retry attempt; for the orchestrator, plan and phase identity and, per step, which capability ran, how many attempts it took, and whether it succeeded; for memory, which recall paths fired and what they found. The framework deliberately does not estimate cost in dollars — authoritative spend comes from your provider's billing export and negotiated pricing, not from a multiplication the framework guesses at.
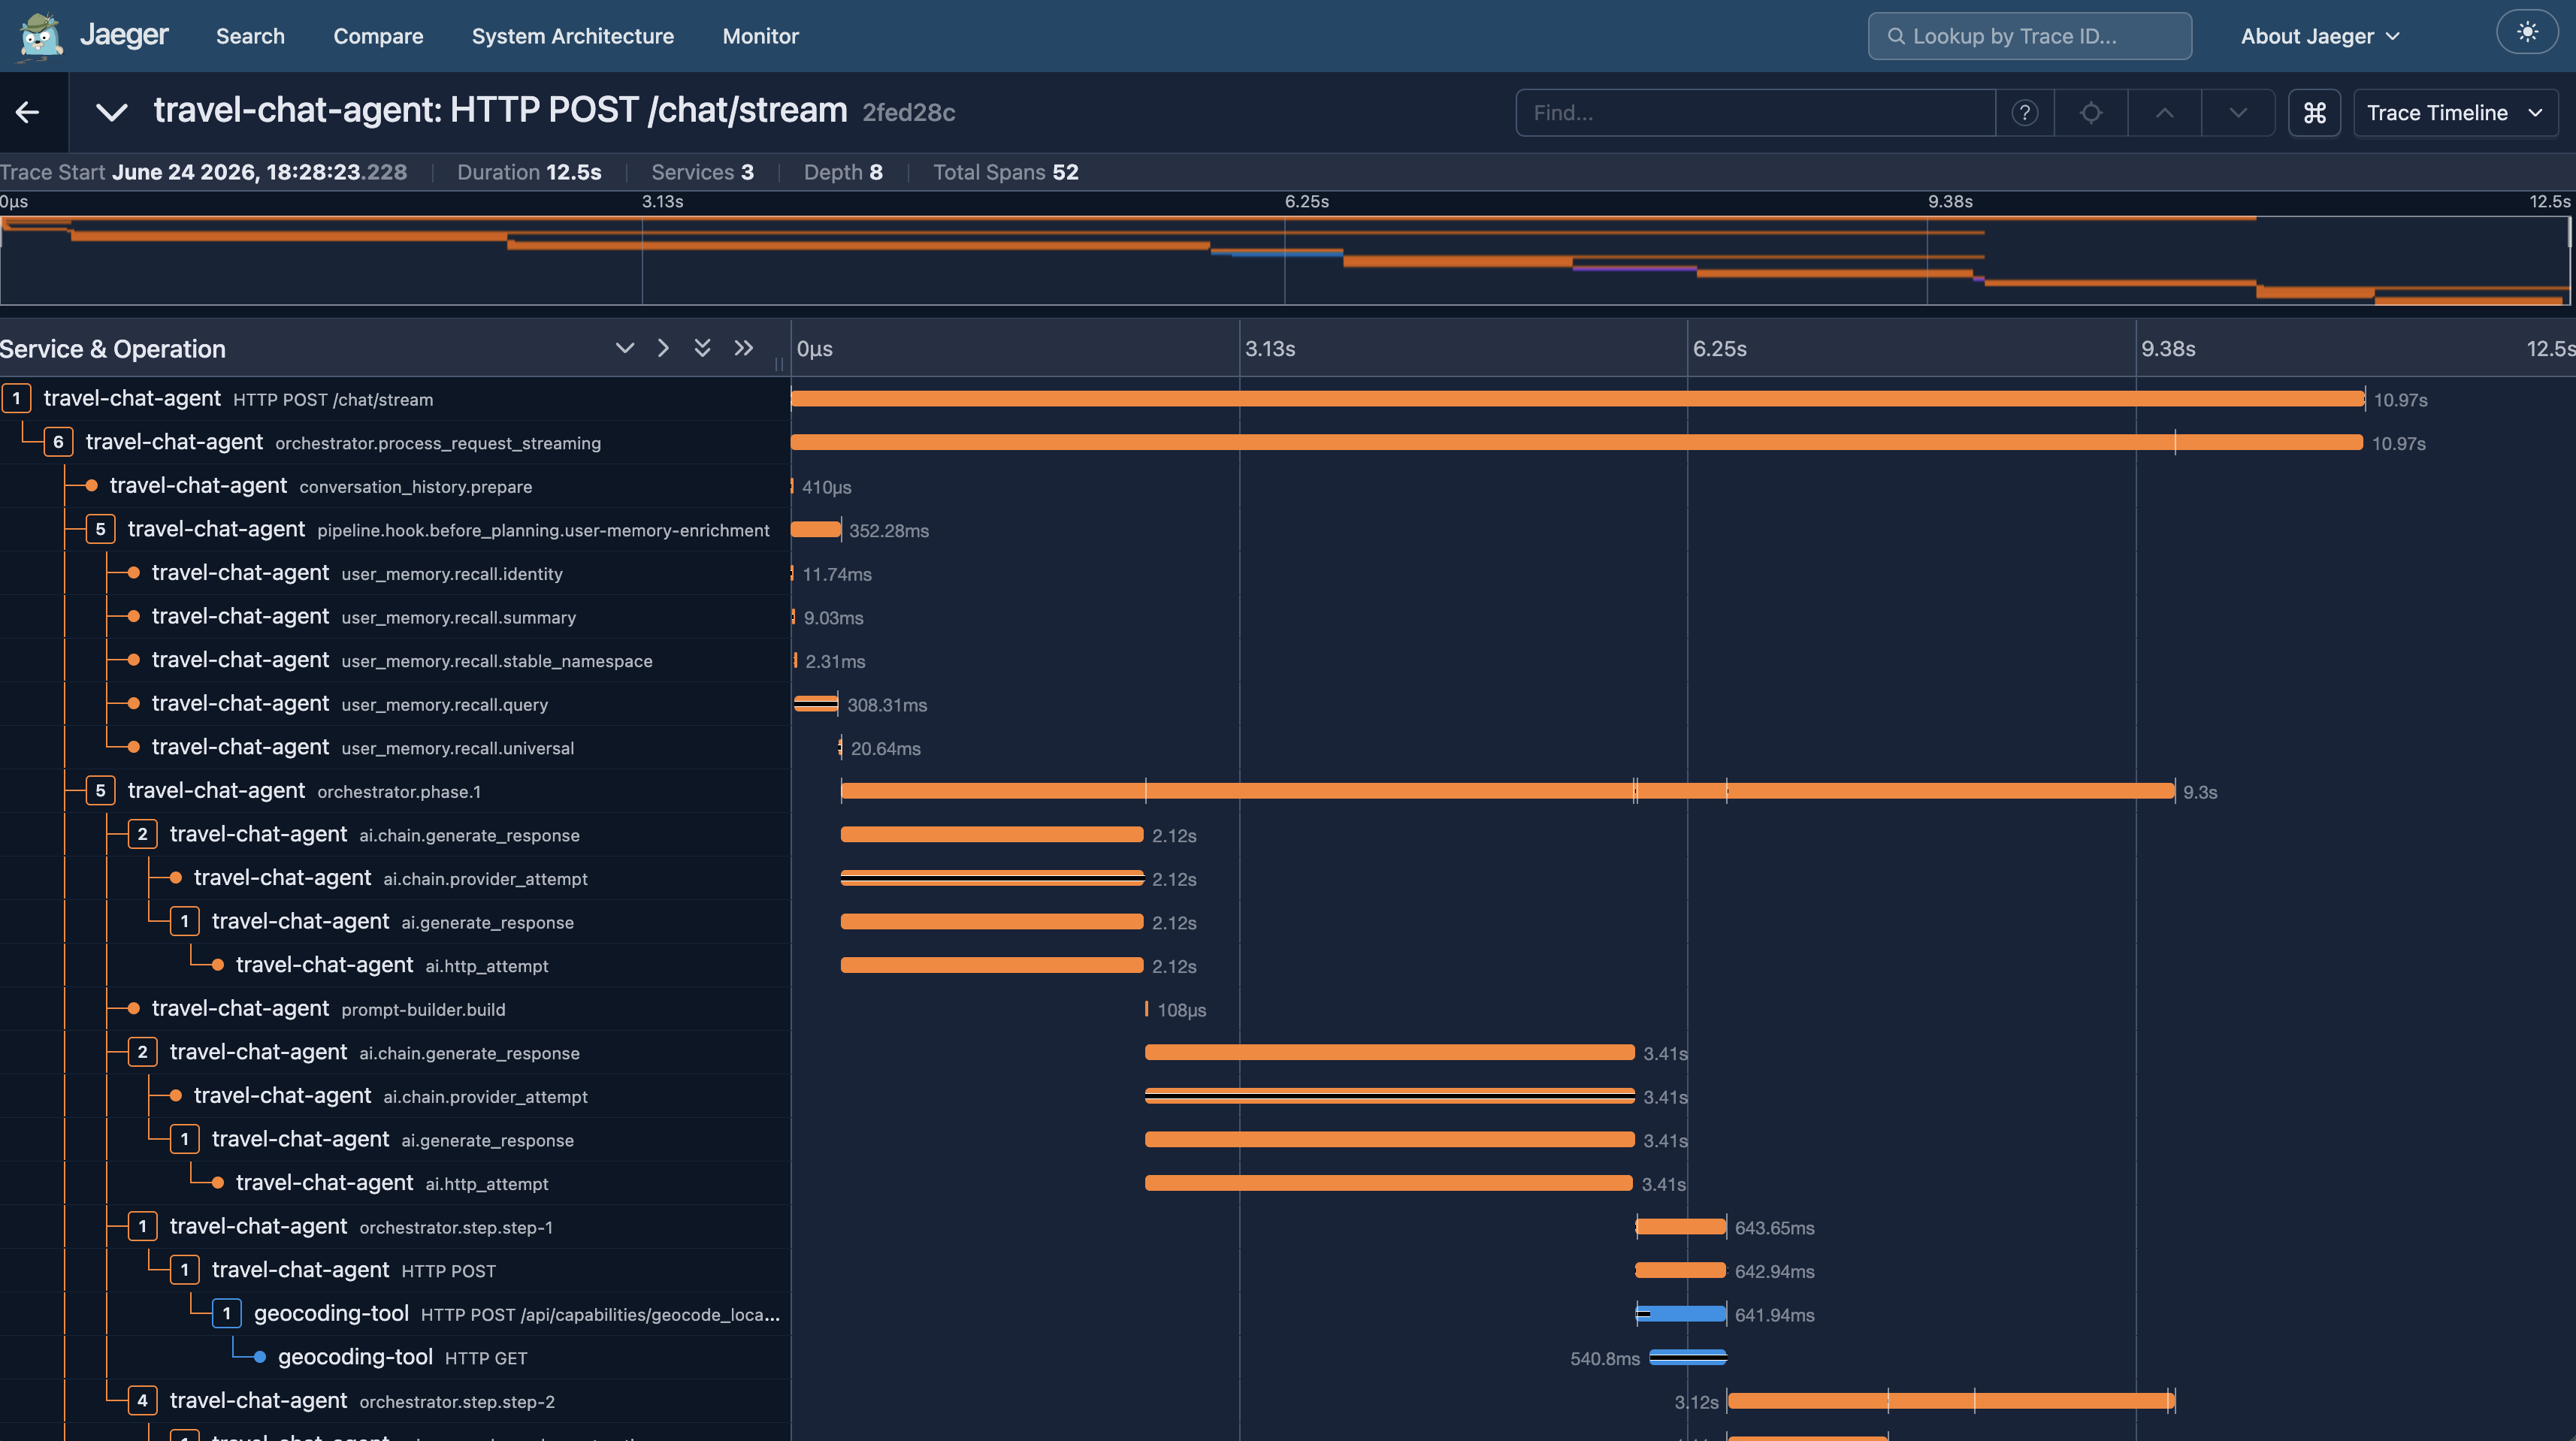
Alongside the traces, more than 240 base metric families export over OTLP with cardinality-protected labels, covering orchestration, AI calls, discovery, memory, approvals, and HTTP at both client and server. JSON logs carry trace IDs from request context, so logs and traces correlate in Loki and Jaeger with no extra wiring.
The bundled local deployment provisions seven Grafana dashboards under a TruvaG3 folder — Platform Overview, Agent Telemetry, LLM & AI Analytics, Orchestration & Execution, Memory & Knowledge, Logs & Traces, and Resource Usage. They work on a fresh install because the metrics they query are the ones the framework emits by default. Two more tools help during development: the Registry Viewer, a web app that inspects the live registry, captured LLM payloads, approval checkpoints, execution DAGs, and shared memory — the same viewer used for the screenshots in the architecture article — and Swagger UI over each component's OpenAPI document.
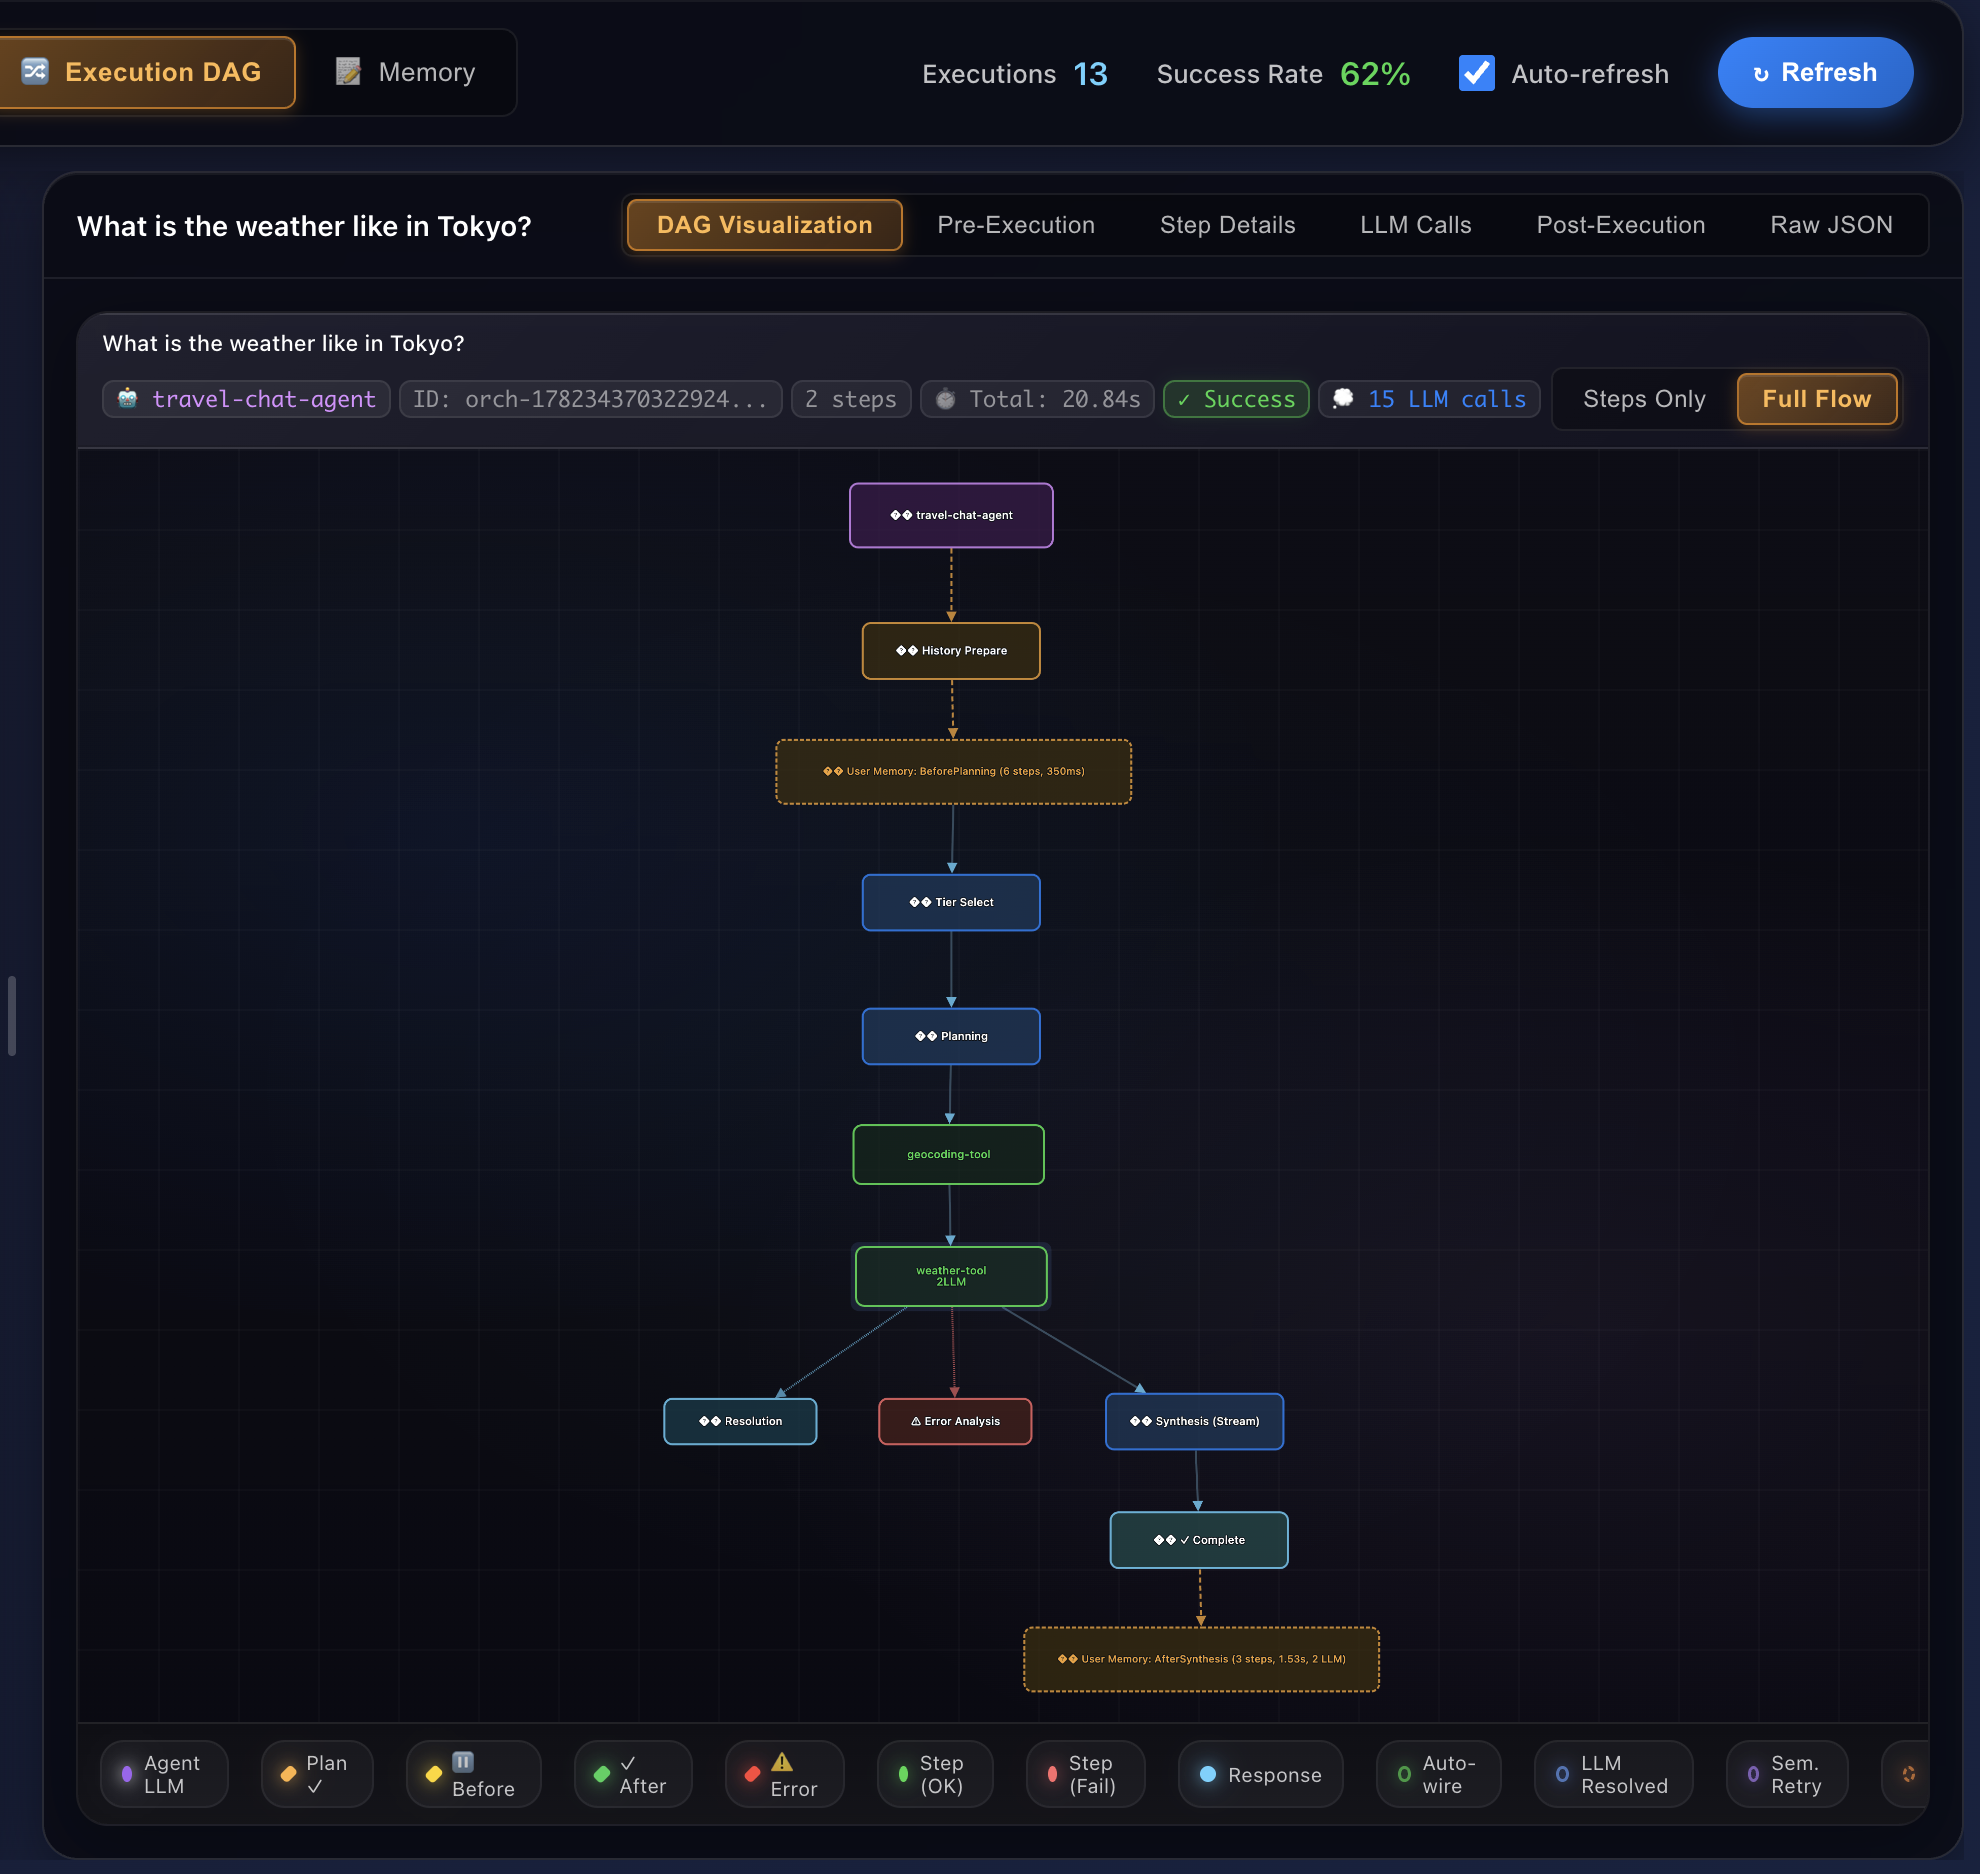
This depth is unusual. Most agent frameworks expose logs and a handful of LLM-call traces; orchestrator-internal state, memory operations, discovery behavior, hook execution, and provider failover paths typically are not instrumented at all. And because TruvaG3 components are ordinary HTTP services emitting OTLP, all of it lands in the observability stack your platform team already operates.
Deep dive: telemetry/README.md · Distributed Tracing Guide · Logging Implementation Guide · Developer Tools Guide.
5. Vendor-agnostic AI provider layer
Agent and orchestration code never sees a provider's HTTP schema or SDK types. The ai module presents provider-neutral contracts — a compact client for the common case, and a request-aware one for applications that need explicit routing, credentials, or policy — and everything above them is written against the contract, not the vendor.
Support is organized by integration surface rather than a headline provider count, because in enterprise deployments a direct API key, an Azure deployment, a Google publisher model, and an AWS inference profile are not interchangeable configuration shapes:
| Integration surface | What it covers |
|---|---|
| Direct HTTP | OpenAI, Anthropic, Gemini |
| Native SDK | AWS Bedrock, behind a build tag, using the Converse API |
| Hosted enterprise profiles | Azure OpenAI (v1 and classic), Claude on Google Vertex AI |
| OpenAI-compatible aliases | Groq, DeepSeek, xAI, Mistral, Qwen, Together, Ollama |
The simple path stays simple: import the provider packages you intend to use, call ai.NewClient(), and the framework detects a configured provider from the environment. The enterprise profiles are deliberately not auto-detected — Azure and Vertex require application-supplied routing and explicit credentials, which keeps tenant, region, deployment, and short-lived token decisions in your code rather than buried in environment-variable conventions.
Semantic model roles instead of hardcoded model IDs. Application code asks for a role — default, fast, smart, premium, code, or vision — and each provider's catalog resolves it. Today default maps to GPT-4.1-mini on OpenAI, Claude Sonnet 4.5 on Anthropic, and Gemini 2.5 Flash on Google, while smart maps to o3, Claude Sonnet 4.5, and Gemini 2.5 Pro. Environment variables override any mapping. The role stays stable for policy decisions even when the wire destination resolves to a deployment-specific Azure or Vertex identifier.
Failover chains, including heterogeneous ones. A chain can be built from provider aliases, or assembled from independently configured clients — Azure OpenAI first, Claude on Vertex second, direct Anthropic third. Failover triggers on provider-specific failures: authentication, rate limits, upstream server errors, network failures, quota. A malformed request aborts the chain instead of replaying a bad payload against three vendors in turn. Streaming fails over only before the caller sees output; once a chunk is on the wire, the chain never restarts the answer somewhere else. Failure metadata is sanitized before it reaches logs, traces, or metric labels — raw provider and credential errors go to the caller, not into your telemetry.
OPENAI_API_KEY says nothing about whether Anthropic or Gemini will answer. The chain moves on. A 400 is the opposite: the payload is wrong and will be wrong everywhere, so replaying it three times only multiplies the bill. Streaming adds the one constraint the rest of the design bends around — once a user has seen a token, the answer cannot be quietly rewritten by a different vendor.Extending is layered: configure a built-in provider when only keys or models differ, extend a request-aware one when credentials, routes, or HTTP transport differ — the path Azure, Vertex, and private gateways take, with hooks for per-request endpoints, rotating credentials, and an application-owned HTTP client for corporate CAs and proxies — and implement a new provider only when the wire format itself is different.
Working examples. agent-with-orchestration and travel-chat-agent both construct a chain client in auto-detect mode, with commented alternatives for explicit ordering.
Deep dive: ai/README.md · AI Providers Setup Guide · Custom AI Providers and Enterprise Integration Guide.
6. Orchestration
The orchestrator turns a list of capabilities and a natural-language request into an answer. It is the part of the framework that most directly uses the microagents architecture: no hand-written routing graphs, no pre-wired tool list in source, just a plan generated against whatever is in the registry the moment the request arrives.
The loop is plan, execute, synthesize. A request arrives; the orchestrator hands the live capability catalog to the LLM and asks for a plan; the LLM returns a DAG of steps, each naming a capability and its dependencies; the executor runs independent steps in parallel and dependent ones in topological order; a synthesis call composes the response. Every layer emits its own span, so a trace shows the plan, each phase, each step, and the synthesis separately rather than as one opaque block.
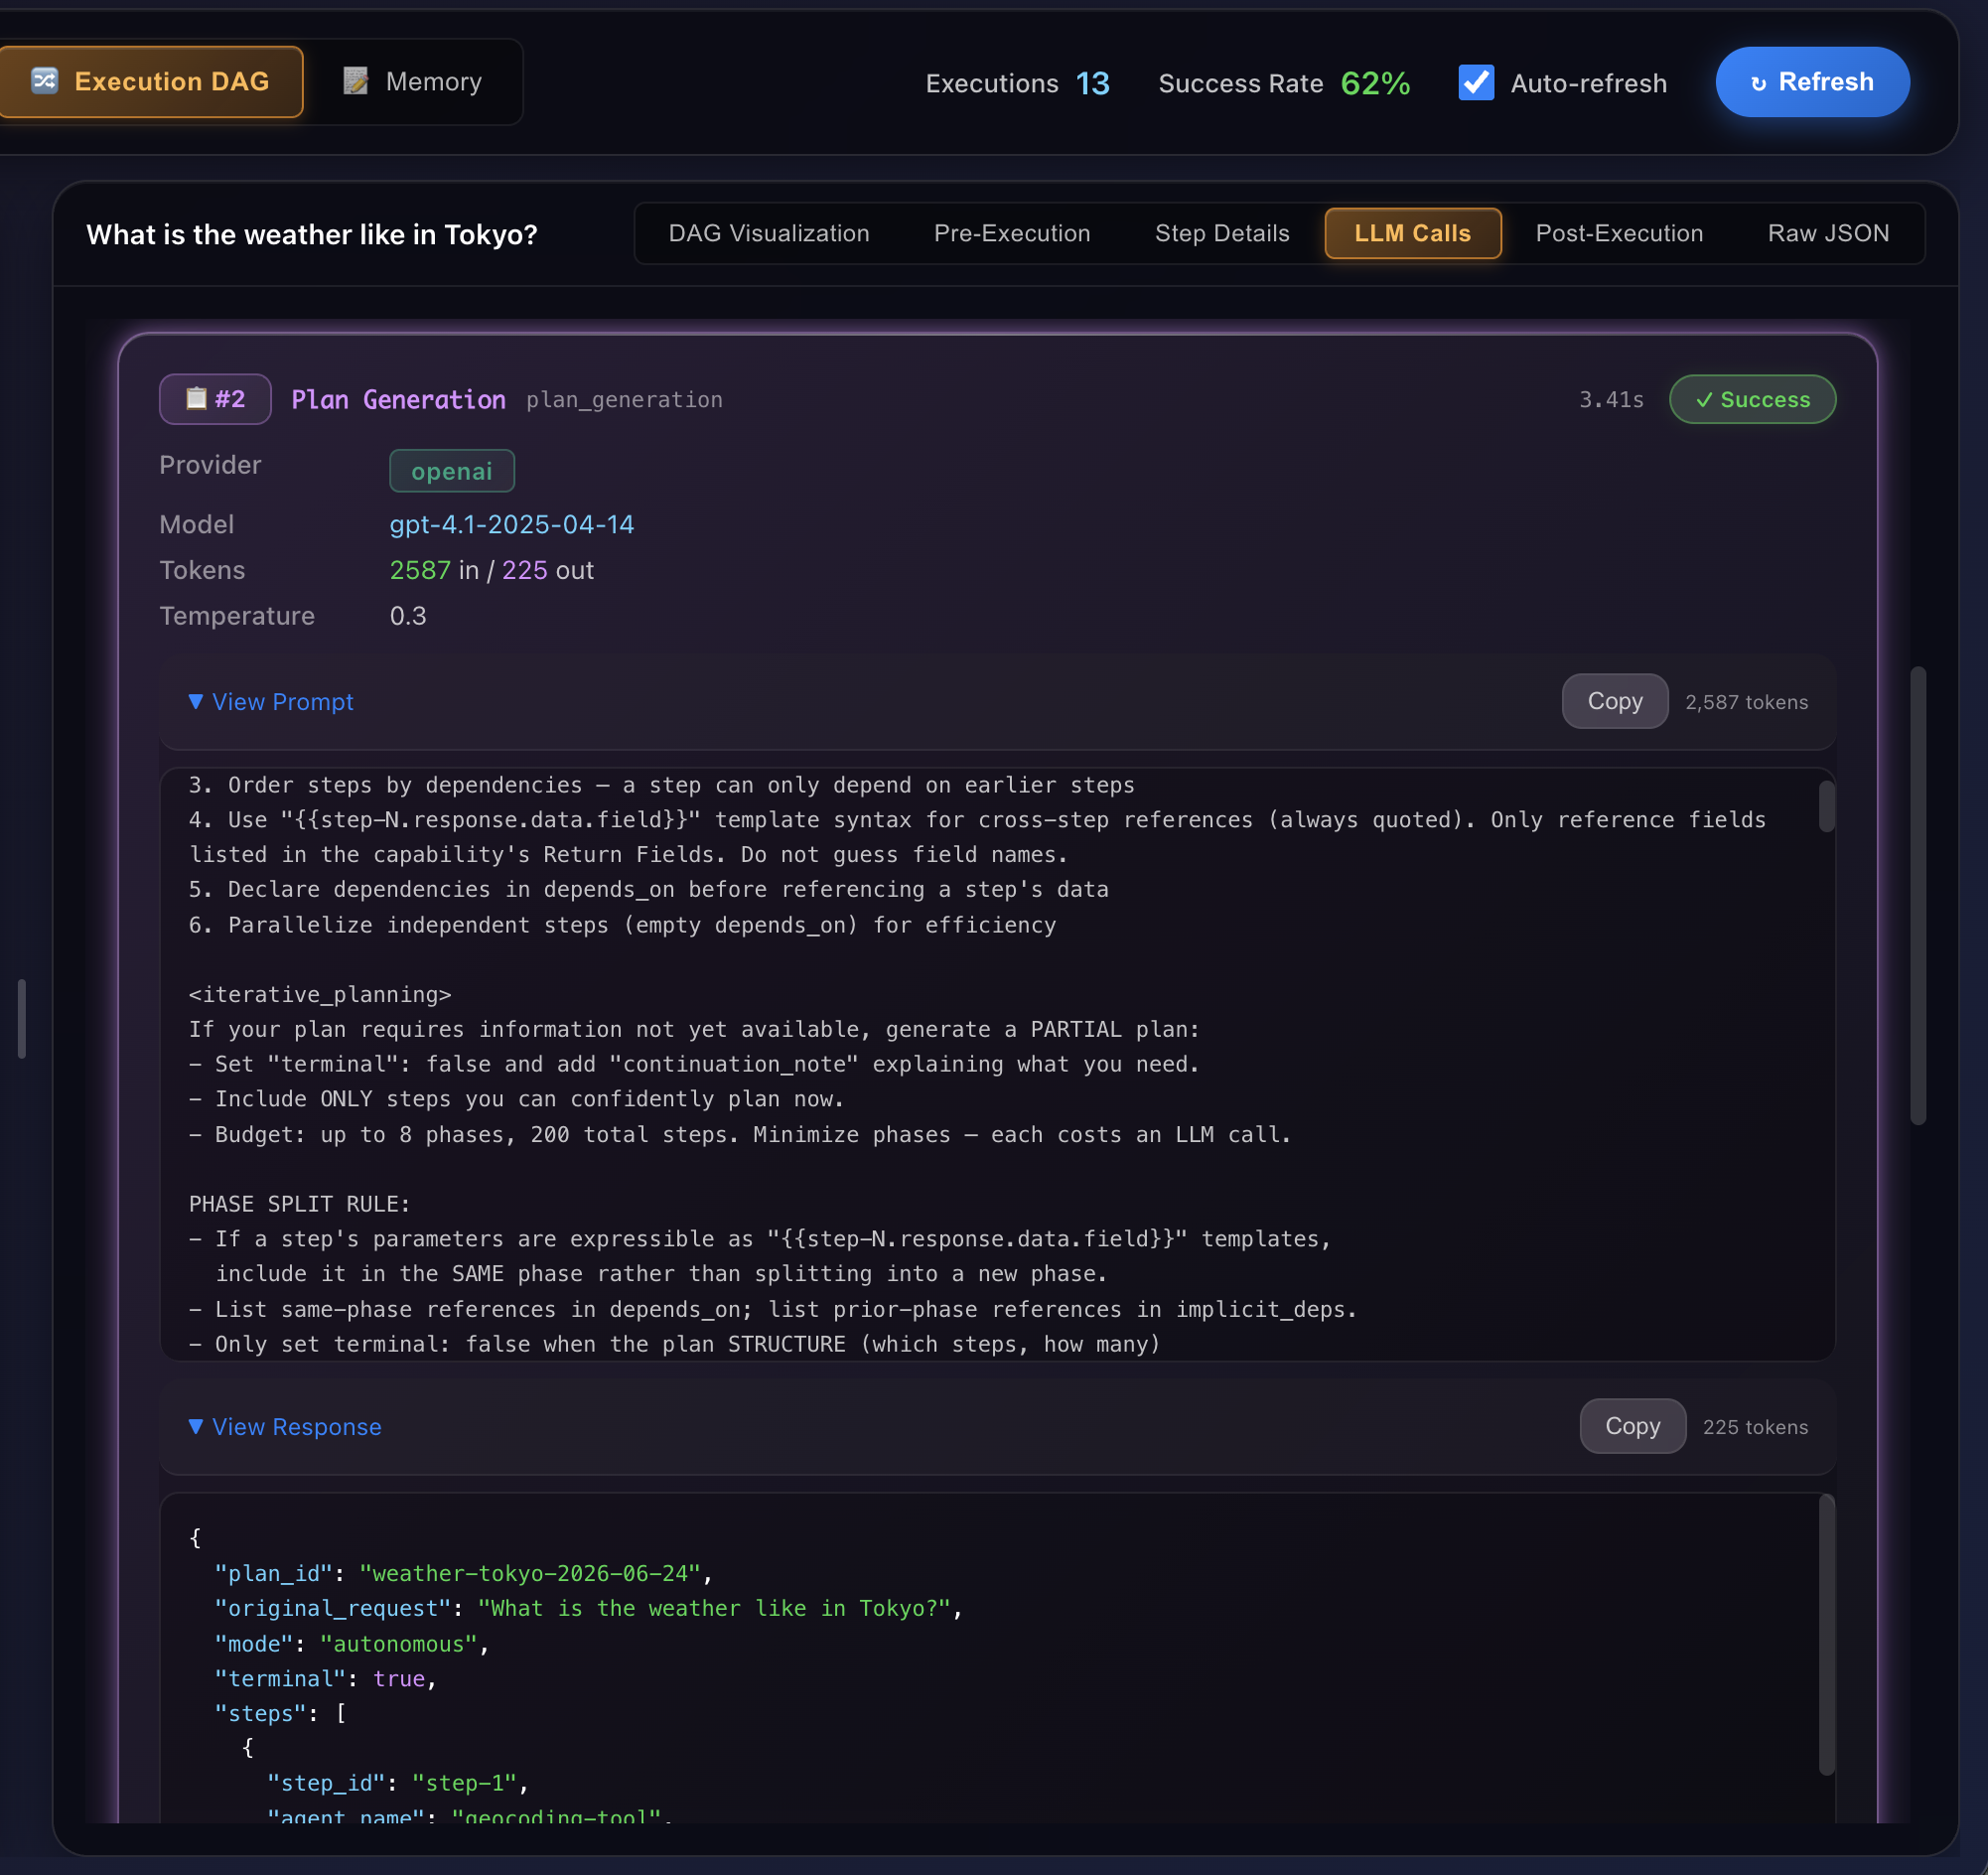
When one plan is not enough, the orchestrator re-plans. Some requests cannot be planned upfront — the destinations come from a search, the coordinates come from geocoding, the next step depends on what the last one returned. After a phase completes, the orchestrator can return to planning with the fresh results as context. The Switzerland trip in the architecture article is this in practice: phase one runs a single web search, phase two fans out three parallel geocoding calls, phase three fans out six parallel weather and hotel calls — ten tool invocations across three phases, six-way parallelism at peak, 29 seconds wall time. Phase count, total steps, and per-phase timeout are bounded by default and tunable per deployment.
Plans are validated before any step runs. LLMs occasionally produce structurally invalid plans: a dependency on a step that does not exist, a cross-phase reference to a step never created, an unregistered macro. Each class is caught before execution and counted separately, so a rising rejection rate tells you the planning prompt has drifted or a model swap went badly — visible on a dashboard without reading a log line.
Large catalogs get a two-step selection. Past about twenty registered capabilities, sending every schema on every planning call wastes tokens and eventually overflows the context window. The orchestrator instead sends lightweight summaries, asks the planner which tools it wants, and fetches full schemas only for those.
Skills add reusable know-how without filling every prompt. An agent developer binds a versioned skill by its namespace and name. At the start of each request, orchestration resolves those bindings together, activates only the relevant skills, and loads detailed resources only at the planning or synthesis boundary that needs them. A binding to published sees a new publication on the next request, while a numeric binding and an in-flight request keep their exact pinned versions. The storage interface is provider-neutral, Redis is the included adapter, and the Registry Viewer plus Jaeger show the body-free selection and loading trail.
Failed steps get more than a blind retry. Transient transport errors are handled by exponential backoff. Input-level failures — wrong field name, missing value, ambiguous parameter — go further: the orchestrator hands the LLM the error, the original payload, and the capability's input schema, and asks for corrected parameters before the next attempt.
Two smaller things happen along the way: oversized tool responses are trimmed before entering the next prompt, preserving JSON shape and key names; and when the planner needs something it cannot infer, such as a date or an account ID, it returns a structured clarification request rather than inventing a value.
Working examples. travel-chat-agent, devops-chat-agent, and agent-with-orchestration all wire the dynamic orchestrator; the traces they emit are the source of the captured executions in the architecture article.
Deep dive: orchestration/README.md · LLM Planning Prompt Guide.
7. Reliability and error recovery
Failure is normal in distributed systems. Networks degrade, external APIs rate-limit, downstream services go through deployments, and LLMs sometimes pass slightly wrong arguments. A framework that ignores this turns every transient problem into a user-facing error. The orchestrator-internal recovery layers are covered in §6; this is the foundation underneath them.
Tools return typed errors, not opaque strings. Every error carries one of five categories, and each tells the orchestrator what to do next. INPUT_ERROR means the request was malformed, which is exactly the case the LLM error analyzer can fix. RATE_LIMIT and SERVICE_ERROR are retryable with backoff. NOT_FOUND surfaces to synthesis so the answer can say the resource is missing. AUTH_ERROR is not retryable at all — there is no point retrying the same bad token — so it escalates to an operator. Because the category is explicit, the orchestrator's response is deterministic rather than guessed from the wording of an error message.
Retries back off and jitter. Each step gets an initial attempt plus two retries by default, the wait doubling from 100 ms up to a five-second cap, with ±10% jitter so a fleet of agents retrying against the same backend does not synchronize into a thundering herd.
Circuit breakers isolate a misbehaving downstream. Any agent can wrap outbound calls in a breaker. Closed, calls flow through. Open, they fail fast without touching a service that is already struggling. Half-open, a limited number are let through to test recovery — success closes the breaker, failure reopens it. State, transitions, and outcomes are instrumented, so a Grafana panel shows immediately which downstream services are degraded.
A recovered request panic does not take out the pod. A dependency can panic while processing an unexpected value — for example, through a nil dereference inside a third-party library. The framework wraps request execution paths with recovery, so that panic is caught, logged with its stack trace, and converted into a structured error returned to the caller. The process keeps serving everything else.
How the pieces fit together. A typical failure, end to end: an agent makes an outbound call through a closed breaker; the downstream tool returns RATE_LIMIT; the step-retry layer sees a retryable category, waits with backoff and jitter, and tries again; the second attempt succeeds and the breaker records it. Had the rate limit persisted across every retry, the request would have failed with a clean structured error rather than hanging. Had many agents been hitting the same limited tool, the breaker would have opened and shed load. Had the tool panicked inside a protected request path, the panic would have become a SERVICE_ERROR response instead of crashing the process.
Working example. agent-with-resilience wires all of it — per-tool breakers, combined retry-plus-breaker execution, explicit timeout control, and a status endpoint exposing breaker state per downstream tool.
Deep dive: resilience/README.md · Error Handling Guide · Intelligent Error Handling.
8. Async tasks and scheduling
Agent work is not millisecond work. A single model call can take 5–60 seconds, a rate-limited external API 10–120 seconds, document processing several minutes, and a step gated on human approval longer still — so a research workflow that chains a dozen of them may run for minutes or hours. Held open that long, a synchronous HTTP request can collect timeouts at every hop, tie up request resources, give the user no progress signal, resist cancellation once it has gone off course, and turn an impatient client retry into duplicate work. A nightly batch at 2 AM, meanwhile, is not waiting for anyone at all. The framework covers both cases as separate subsystems.
Async tasks follow the standard 202-and-poll pattern: the client posts a request, the API validates it, creates a task, enqueues it and returns a task ID with a status URL in about ten milliseconds. A worker pool blocks waiting for work rather than polling for it, and reports structured progress as it goes — current step, total steps, percentage — into a task store the API reads when the client asks. So a polling client sees "step 2 of 3, 60%" rather than an opaque spinner, and can cancel a task at any point rather than waiting out a mistake. Task duration and the wait before a worker picks a task up are both instrumented, and a climbing wait time is the canonical "add workers" signal. The same binary runs all of it in one process for development, or splits into API pods and worker pods that scale on different signals — request rate and queue depth — in production.
Scheduled execution lets any agent or external system create a schedule against any target agent, using exactly one of three primitives: a relative delay ("check this order in 15 minutes"), an absolute run_at ("send a reminder at 6 PM on launch day"), or a cron_expr for recurring work ("the compliance check every weekday at 9"). Three independently deployable roles make it work — a scheduler tool that owns the schedule API and is discoverable like any other tool, a horizontally scalable executor that polls for due work and atomically claims it so two workers never fire the same schedule twice, and any target agent that opts in with one line and then receives scheduled requests through the same orchestration pipeline as its chat traffic.
Pick your delivery guarantee. Every backend in both subsystems sits behind an interface, so Redis is a default rather than a requirement — Postgres, SQS or an in-memory implementation for tests all satisfy the same contracts. The delivery choice specifically governs the executor's handoff to an agent. At-most-once is the default: the task leaves the queue the moment it is consumed, so an executor that dies mid-dispatch loses that run — simple, no consumer groups, no reaper, and correct whenever a missed run is cheaper than a duplicate one. At-least-once uses Redis Streams, where the task stays pending until it is acknowledged and a companion reaper reclaims work stranded by a crashed replica; your handler has to be idempotent in exchange, which is the right trade for financial actions and compliance jobs. Switching is a wiring change in main.go — no application logic moves.
Events are a third trigger. Neither a waiting caller nor a clock is required — another system can start the work on the same machinery. The bundled event-driven-agent receives Prometheus AlertManager webhooks and turns critical alerts into AI-driven incident investigations, with severity routing and fingerprint deduplication deciding in ordinary code which alerts are worth a model call at all, and human approval gating the destructive writes an investigation might propose. That pattern differs enough from request-response agents to warrant its own treatment.
Working examples. agent-with-async demonstrates API mode, worker mode, and embedded mode. scheduler-tool and scheduled-executor make up the complete scheduling stack, and event-driven-agent runs the webhook path in the same three modes.
Deep dive: Async Orchestration Guide · Scheduled Tasks Guide.
9. Human-in-the-loop
Some decisions are too consequential for an agent to make alone — placing a trade, deleting production data, sending mass communications, approving a refund above a threshold, changing infrastructure on a live cluster. Regulated industries require approval points as a compliance control regardless. TruvaG3 pauses an in-flight request at a defined moment, persists the execution state, notifies a reviewer, and resumes or aborts on their decision. From the user's side the request stays continuous, even when the human takes hours.
Five interrupt points, chosen by policy rather than hardcoded. The orchestrator can pause right after a plan is generated, so a reviewer sees the whole DAG before anything runs; before a specific step, to gate individual writes to a sensitive system while reads pass freely; after a step, so the decision is made on the actual result rather than the intent; on an error the framework cannot recover from; or to gather context the agent cannot obtain on its own.
Seven decision types, not just yes and no. A reviewer can approve, reject, or abort — but also edit the plan or a step's parameters, skip an irrelevant step and let the rest run, retry with corrected parameters, or respond with information the agent asked for. This matters more than it sounds. An approval flow offering only approve and reject forces a round-trip: reject, regenerate, review again. With edit and retry, a reviewer makes a single-touch correction and the workflow continues — a five-minute round-trip becomes a one-second adjustment.
Checkpoints are persistent, while storage stays pluggable. When an interrupt fires, the full execution state — plan, completed step results, LLM context, conversation history, interrupt reason — is saved through a small persistence interface. Redis is the included default, not a requirement; another backend can implement the same contract. Notification goes out only after the authoritative pending checkpoint has been saved, so a reviewer never receives a link to half-prepared state. An SSE stream can notify a chat UI immediately, and the reviewer's decision can still arrive hours later through a REST call or a webhook.
Duplicate protection depends on what is being processed. A normal reviewer command first checks that the checkpoint is still pending, so a later duplicate is rejected after the first decision changes its status. Expiry workers use a stronger atomic lease, which prevents two replicas from applying the same timeout at once. Two truly simultaneous reviewer submissions are not advertised as a general exactly-once transaction, so callers should not build correctness around exactly-once delivery of reviewer commands.
Timeouts fail safe. Every checkpoint expires, and expiring without a decision defaults to reject — the high-stakes action does not happen automatically — or, for error escalations, to a clean abort. Both are overridable per deployment or per checkpoint.
Notification remains an integration concern, so the framework ships a webhook handler that fires the moment a checkpoint is created and leaves delivery to Slack, Teams, PagerDuty, or an internal approval system. One metric is worth knowing by name: approval latency, from checkpoint creation to decision. It drives user-facing latency for every gated workflow, and a 95th-percentile dashboard on it either proves your compliance SLA or disproves it.
Working example. agent-with-human-approval demonstrates the complete pattern — SSE notification in the browser, a structured approval dialog, plan-level and step-level approval chained together, auto-resume on timeout, and edit support.
Deep dive: Human-in-the-Loop User Guide.
10. Memory and context
A stateless agent starts every request from zero. It does not remember the user's last question, the answer it gave five minutes ago, the investigation its peers have been running, or anything the user said they prefer. For some workloads that is fine. For chat agents, multi-step research, ongoing investigations, and assistant-style products it is the difference between helpful and amnesiac. TruvaG3 ships three tiers, with shared agent memory and per-user memory kept separate so one process can serve many users without leaking one user's facts into another's context.
Component key-value memory is the simple tier — get, set, delete, exists — for small local state like a session counter or a cached response that does not need to be shared across replicas. In-memory for tests, Redis for production.
Shared agent memory is for agents working a common domain — a fleet of DevOps agents on one incident, research agents covering related topics. An append-only episodic log records what happened; a vector-backed knowledge store, with Qdrant as the reference backend, surfaces learned facts as relevant context when a request arrives; and lightweight activity coordination keeps concurrent agents from duplicating work, so Agent A announces it is investigating order #1234 and Agent B moves on to something else.
Raw episodic events pile up fast, and left alone they make recall increasingly noisy while durable patterns remain hard to find. An opt-in reflection job periodically summarizes older events through the LLM and stores the resulting knowledge fragments for later recall. It is what a team does in a retrospective — extract the durable lessons from the ephemeral activity, and move on.
Per-user memory runs in three stages. Extraction pulls candidate facts from what the user said. Reconciliation checks each against what is already known and classifies it as new, a refinement, a contradiction, or a duplicate. The contradiction path matters most because it lets an agent update itself gracefully when a user says, "Actually, never mind; I prefer X now." Recall then runs five paths in parallel on the next request and merges them, each with its own span so you can see which ones shaped a given answer. A single API call implements a GDPR-style forget operation, removing every fact, embedding, and summary tied to a user ID.
Conversation history is protected automatically. By default the framework tracks a token budget and lets raw turns through; past a configurable threshold it recursively compacts older turns into a rolling summary, freeing budget for the live exchange. Teams with specific rules — preserve every tool result, drop greetings — can supply their own compactor. Most never need to.
All three tiers connect to the request path through pipeline hooks (see §13): recall before planning so facts enter the prompt, extraction after synthesis so what was learned gets persisted. Memory is therefore configurable per agent — a tool-only deployment opts out, a chat agent turns on all three, a regulated workflow swaps in a hook that audits every write.
Working examples. travel-chat-agent and devops-chat-agent both wire shared and per-user memory through hooks; their traces show recall firing on the way in and extraction firing after synthesis.
Deep dive: memory/README.md · Agent Memory User Guide · Adding Context to Your Agent · Conversation History Guide.
11. Chat agent reference pattern
A practical chat agent needs more than an LLM call. It has to stream, so a long answer does not block on a final newline. It has to keep session state, so the user's previous turn still exists. It has to carry multi-turn context without overflowing the window, route sensitive actions through approval, and survive page refreshes, network blips, and duplicate tabs. TruvaG3 ships a reference pattern that handles all of it, exercised by the bundled chat agents and consumed by the bundled chat UI.
The event stream is typed, not a stream of opaque tokens. Eight Server-Sent Event types tell the frontend exactly what it just received: a new session ID, a human-readable status update ("Phase 2 of 3…"), a completed step with tool name and duration, a text chunk, token usage, a finish reason, a done event with total timing, and a structured error carrying a retryable flag. This is the difference between a chat UI that feels rough at the edges and one that feels finished — a frontend developer wires each event to a specific affordance instead of parsing message text and guessing at intent.

step for the tools, done for the timing, usage for the tokens — rather than a number the frontend had to parse out of a message or ask a second endpoint for. Rendered by the bundled chat-ui example.Sessions live in Redis with a sliding window. Each record carries the user ID, metadata, message history, and timings, under a configurable TTL and a maximum message count that evicts the oldest turns automatically. A per-user index and an active-session counter back the capacity dashboards, and a background cleanup job keeps the Redis footprint bounded.
Multi-turn context needs no handler code. The request body carries a session ID; the framework looks up that session's recent messages, packages them into orchestration metadata, and the conversation-history layer from §10 handles the rest.
Approvals resume inside the conversation. When a chat request hits a checkpoint (see §9), the session context is persisted alongside it. Hours later, when the reviewer approves, execution restarts in the same session — history intact, orchestrator picking up where it stopped, SSE events flowing to whichever client is currently watching. The user sees a continuous conversation; the operator gets a clean audit trail of who approved what.
Working examples. travel-chat-agent and devops-chat-agent wire the full pattern, both exposing an SSE stream plus session management on Redis; devops-chat-agent specifically demonstrates approval resumption, since most operations against production need gating. The chat-ui example ships several frontends — a generic chat, a DevOps-styled chat, an approval dashboard, and an overview — deliberately plain HTML and vanilla JavaScript with no build step, so they are easy to read and adapt.
Deep dive: Chat Agent Guide · Chat Session Management Guide.
12. Security and request propagation
The framework takes a deliberately narrow role in security. It does not replace your identity provider, your service mesh, your ingress controller, your network policies, or your secrets manager. Those exist, your platform team runs them, and they work on TruvaG3 components the same way they work on every other REST service in the cluster — because TruvaG3 components are REST services. What the framework adds is the narrow set of things an agent workload specifically needs: getting a user's token through a chain of agent and tool calls, carrying tenant and audit metadata along the same path, and keeping its own headers from being clobbered.
Three ways to attach a bearer token layer from least to most specific. An environment variable covers static service-to-service tokens. A config object covers a token loaded from a vault at startup. Per-request context injection covers user-token pass-through — the handler pulls the token off the incoming request, and every downstream call that request makes runs as the calling user. Per-request values override config, and config overrides environment. A thread-safe setter refreshes tokens at runtime: in-flight requests finish on the old token, while new requests pick up the new one without a restart or a synchronization gap.
Custom headers propagate the same way. Agent workloads almost always carry more than auth — a tenant ID for routing, a correlation ID for the audit trail, a feature-flag bucket. Config-level defaults apply to every outbound call; per-request values override them. The propagated-header field is excluded from the config struct's JSON serialization, so those values cannot leak into request logs or telemetry by accident.
Nine headers are reserved. The orchestrator sets Authorization and Content-Type, plus seven X-TruvaG3-* headers identifying the request, step, plan, phase, originating agent, the top-level request in a chained call, and the owner of an ongoing investigation. If application code tries to propagate one of those names, the framework's value wins, so a stray propagation cannot silently break authentication, trace correlation, or approval resumption. None are hidden — a tool receiving them can use them for authorization or audit.
Secrets and configuration follow Kubernetes conventions — credentials from environment variables sourced from Secrets, non-sensitive settings from ConfigMaps — so whatever workflow you already run, from ExternalSecrets to Vault sidecars, works unchanged. Developer-facing surfaces are off by default: OpenAPI generation is opt-in because the document describes the component's full API, and the Registry Viewer and Swagger UI belong behind the network, gateway, or mesh layer, like a database admin console.
End-to-end flow. A request hits the agent's ingress with an Authorization header. The agent extracts the user's token, passes it through context, and calls a downstream tool. The outbound call carries that token, the tenant ID from config, and the framework's request and step IDs. The tool authenticates against your existing identity provider, logs the request ID for audit, applies tenant-scoped authorization, and returns. Traces, logs, and audit data all correlate on the request ID. Nothing about that flow is framework-specific — it is what a well-built REST deployment already does.
Deep dive: OAuth Security Guide.
13. Extension points
The framework exposes interfaces at the boundaries where teams are most likely to need something different, each with a working default behind it.
Pipeline hooks are the main one — per-stage middleware around the orchestration pipeline, letting application code inject context, mutate plans, or post-process responses without forking anything. There are four stages. BeforePlanning runs before the planner and is the only stage that can short-circuit the whole pipeline, which is how a semantic cache returns an answer without calling the LLM at all; it is also where RAG context and conversation history get injected. AfterPlanning can validate or rewrite a plan before execution. AfterExecution is observe-only, for analytics and audit logging. AfterSynthesis is where PII redaction, content policy checks, and memory writes go. A hook callback that returns an error logs a warning and the pipeline continues. A malformed provenance-aware short-circuit is different: it is a programming or configuration error, so the request stops instead of quietly bypassing cache-safety checks.
Custom prompt builders control the application-authored parts of prompt construction while preserving the orchestration interfaces — useful for compliance instructions, custom output formats, tenant-aware system messages, or domain-type rules that teach the planner your vocabulary. The framework still finalizes its protected envelope afterward. For example, it appends one canonical <runtime_context> block to planning system messages, so a custom builder cannot accidentally remove the current-date contract or emit competing copies.
Every backend sits behind a Go interface. Discovery, LLM clients, component memory, async task queues and stores, scheduling stores and dispatchers, embedding clients, and the debug stores all have included defaults. OrchestrationBackends groups the state and coordination capabilities an application has chosen, so replacing Redis with another provider changes the composition code at startup, not the request-processing logic. In-memory and mock implementations remain available where they are useful for tests.
Contract tests cover the seams where the framework promises portable behavior today. The reusable suites cover task delivery and orchestration persistence, coordination, workflow state, and distributed locks. They let a replacement backend prove the same cross-instance and delivery guarantees as the included implementation. Other interfaces still need focused tests in the provider package rather than inheriting a conformance promise the framework has not defined.
Result processors control how large tool and agent results are trimmed before they enter LLM prompts. The default preserves JSON structure, key names, and representative samples within a byte budget; teams with domain-specific payloads — large clinical datasets, deeply nested telemetry — can replace it behind the same interface.
Deep dive: Adding Context to Your Agent · LLM Planning Prompt Guide · API Reference.
What it looks like in code
Three short examples to make the framework concrete. They are simplified versions of the bundled examples.
A tool
A tool exposes one or more capabilities over HTTP. Here is a weather tool that registers a single capability:
tool := core.NewTool("weather-service")
tool.RegisterCapability(core.Capability{
    Name:        "current_weather",
    Description: "Gets current weather conditions for a location.",
    Handler:     handleCurrentWeather,
})

framework, _ := core.NewFramework(tool,
    core.WithName("weather-service"),
    core.WithPort(8080),
    core.WithRedisURL(os.Getenv("REDIS_URL")),
    core.WithDiscovery(true, "redis"),
)
framework.Run(ctx)
That is the whole tool. The framework registers current_weather into the registry, exposes it at /api/capabilities/current_weather, refreshes the heartbeat every 15 seconds, and shuts down gracefully on a signal.
An agent that uses tools it has never heard of
An agent does not need to know which tools exist. It hands the user request to the orchestrator, which reads the live registry and produces a plan:
orchestrator := orchestration.CreateOrchestrator(config, deps)

response, _ := orchestrator.ProcessRequest(ctx,
    "What is the weather in Tokyo and the stock price of Apple?", nil)
The orchestrator discovers whatever capabilities are currently registered, asks the LLM for a plan, executes the plan as a DAG, and synthesizes the response. The agent's source code names no tool. Deploy a new tool five minutes later, and the same agent can use it on the next request — no code change, no redeploy.
The bundled examples show the same agent picking different capabilities depending on the question. "Weather in Paris" routes to get_current_weather (served by weather-tool-v2); "stock price of Apple" routes to stock_quote (stock-market-tool); "capital of Japan" routes to get_country_info (country-info-tool). No hardcoded routing — the LLM picks the capability from the live registry and the framework resolves it to the address.
One agent calling another
From the calling agent's point of view, an agent and a tool look the same. Both register capabilities into the same registry. Both are dispatched through the same HTTP call. The architecture article walks through a captured multi-domain trace where travel-chat-agent handles a user request that crosses three domains. Its four-step plan includes devops_operations, geocode_location, stock_quote, and get_current_weather. One of those — devops_operations — happens to be served by another agent (devops-chat-agent), which runs its own internal plan-execute-synthesize loop. From the dispatch site, there is no visible difference between the agent step and the tool steps.
Run it on a laptop
The full TruvaG3 stack — registry, the bundled tools and agents, the Registry Viewer, and an OpenTelemetry pipeline — runs on a laptop in a local Kubernetes cluster (Kind). The setup guide walks through the cluster, the Redis or Valkey backend, the AI provider configuration, and the bundled examples.
The two captured executions in the architecture article — the three-phase Switzerland trip plan and the multi-domain agent-to-agent run — both come from this setup. Once the bundled examples are deployed, the same user queries can be run against the same agents, and the Registry Viewer's Execution DAG tab will produce equivalent screenshots and trace JSON files. Nothing in either article is theoretical.
Where to go next
Recommended reading order, by goal:
- Understand the architecture in depth. Read the microagents architecture article. It is the foundation this framework implements.
- Find a specific feature. The Framework Features Guide is organized by capability area and links to module-level documentation.
- Build something. Start with the Getting Started guide for the local Kubernetes setup, then the Tool Development Guide and Agent Development Guide for the build patterns.
- Read source code. The
core/,orchestration/,ai/, andmemory/modules have their own READMEs and architecture documents. Theexamples/directory has working code for tools, agents, chat UIs, and the registry viewer.
© 2026 Neelabh Tripathi. Licensed under CC BY 4.0.