The Failure You Didn't See: An Observability Deep Dive Through One TruvaG3 Request
A single question — "What is the weather like in Tokyo?" — followed all the way down. From the clean answer the user received, through a Jaeger distributed trace, OpenTelemetry spans carrying Gen-AI semantic conventions, logs correlated in Loki, and the registry-viewer's Execution DAG. The answer looked effortless. It wasn't: one tool call failed with a 404 and the agent quietly fixed it mid-flight. This is what it takes to see that. Everything here was captured from TruvaG3[1], an open-source reference implementation running on a laptop.
Contents
- The answer, and everything it hides
- What observability has to mean for an agent
- Lens one: the shape of the request
- Reading a single LLM span
- The failure you didn't see
- Pillar three: the logs, already correlated
- Lens two: the agent-native view
- Four surfaces, four totals
- What this costs you to run
- Run it yourself
- Conclusion
- References
The answer, and everything it hides
Here is the whole interaction, as the person who asked it experienced it. They typed a question into a chat box and, about eleven seconds later, got a tidy paragraph back.
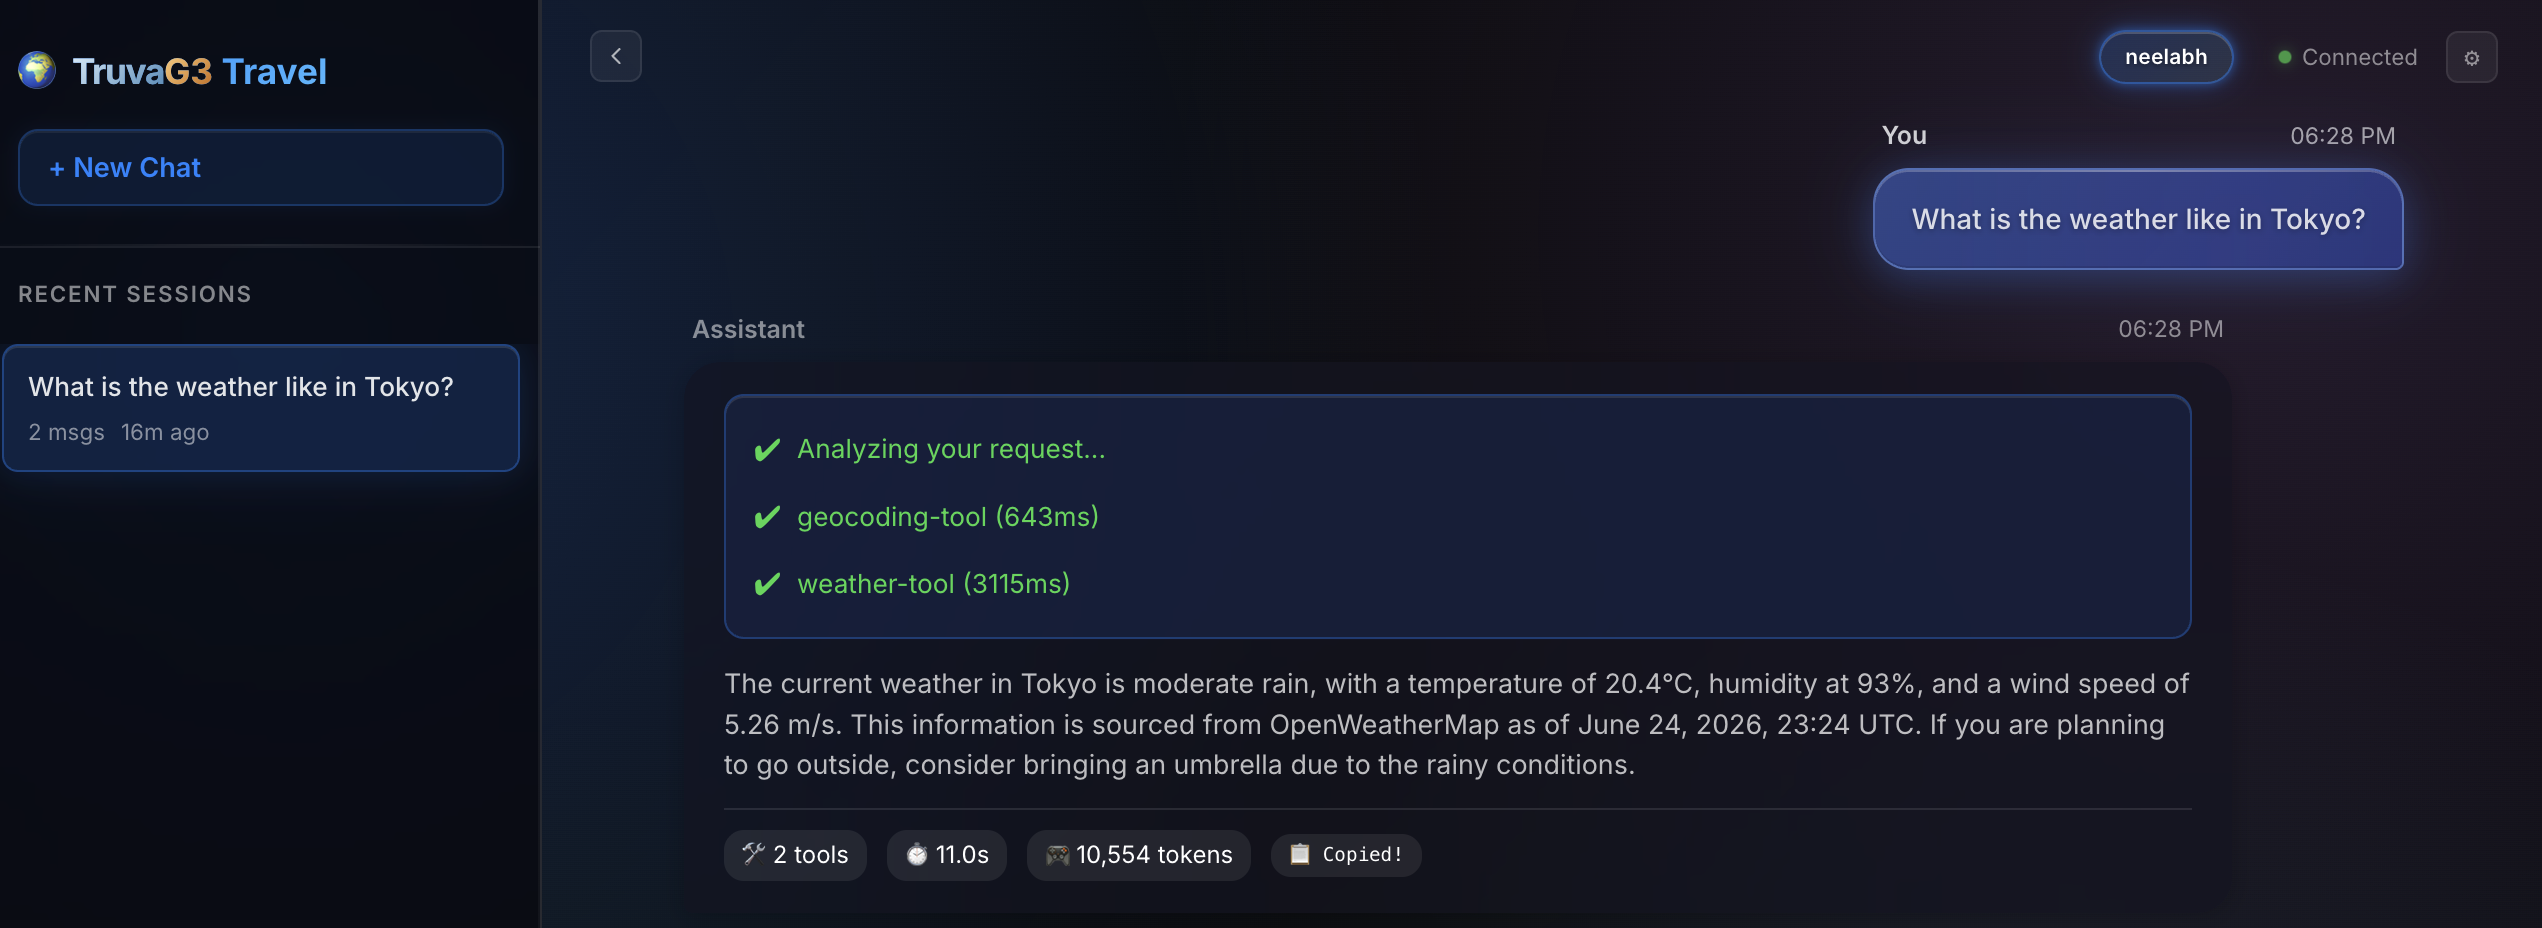
That footer — 2 tools · 11.0s · 10,554 tokens — is the most observability most chat surfaces ever offer. It is true, and it is almost useless if anything goes wrong. It cannot tell you which two tools, in what order, why it took eleven seconds rather than three, what the model was actually asked, or whether the run went smoothly or limped to the finish line. For this particular request, the last question has a surprising answer: it limped. One of those two tool calls failed outright — an HTTP 404 — and the agent noticed, diagnosed the failure, rewrote its own request, and tried again, all before the answer streamed out. The user never saw it. The footer certainly never mentioned it.
This article follows that one request all the way down. We will look at it through two complementary lenses. The first is the vendor-neutral observability stack any production cluster already runs — distributed traces in Jaeger, metrics in Prometheus, logs in Loki, all fed by OpenTelemetry. The second is a purpose-built view of the same run, the registry-viewer's Execution DAG, which shows the things generic tracing structurally cannot: the plan the model wrote, the exact prompts, and the reasoning behind each recovery. By the end, the recovered 404 will be visible from multiple angles, and we will have a precise answer to the question the footer dodged: what actually happened, and what almost didn't?
What "observability" has to mean for an agent
For an ordinary microservice, observability has a well-worn definition: the three pillars of traces, metrics, and logs[8]. A trace shows the path of a request through services as a tree of timed spans. Metrics aggregate behavior into counters and histograms. Logs record discrete events. Correlate them by a shared identifier and you can move from "latency is up" to "this span, on this service, emitted this error" in a few clicks.
An agent needs all three, and then it needs more, because the most important decisions an agent makes are not HTTP calls — they are tokens. A microservice does what its code says. An agent does what a language model decided, one inference at a time: which tools to consider, what plan to write, how to fill in a parameter, whether a failure is worth retrying. If your observability stops at span boundaries and status codes, you can see that the agent called a tool and that the call took 600 milliseconds, but not why it chose that tool or what it asked the model in order to decide. The interesting failures live in that gap.
TruvaG3's telemetry layer[2] is built to close it. Two design choices matter for everything that follows. First, it is OpenTelemetry-native: spans, metrics, and logs are emitted over OTLP to a standard collector, which fans them out to whatever backends you run — here, Jaeger for traces, Prometheus for metrics, Loki for logs, Grafana over the top[15]. There is no proprietary agent and no vendor lock-in; the same signals would land just as happily in any OTel-compatible backend. Second, the LLM interactions are first-class spans annotated with the OpenTelemetry Gen-AI semantic conventions[10] — model name, token counts, and finish reason — and the spans nest naturally, because the agent's work itself nests. A correlation identifier (request_id, mirrored alongside the W3C trace_id[11]) rides through every span and every log line, so the three pillars stitch back together into one story. Let's read that story.
Lens one: the shape of the request
But how do you pull up this one request's trace among the thousands a busy agent emits? You already have the key — it was sitting in the chat footer. The last chip there (the one with the magnifying glass, reading orch-178…) is the request's ID, and it is clickable: tapping it copies the full value, orch-1782343703229248038, to the clipboard. That identifier is the thread the entire observability stack is strung on — TruvaG3 stamps it onto every span as a request_id tag and onto every log line as a request_id field, so it is the one string that finds this request everywhere.

request_id (orch-1782343703229248038) to the clipboard. That value is the handle you carry into Jaeger and Loki.Paste that request_id into Jaeger's Tags filter, scope the search to the travel-chat-agent service, and Find Traces returns exactly one match.
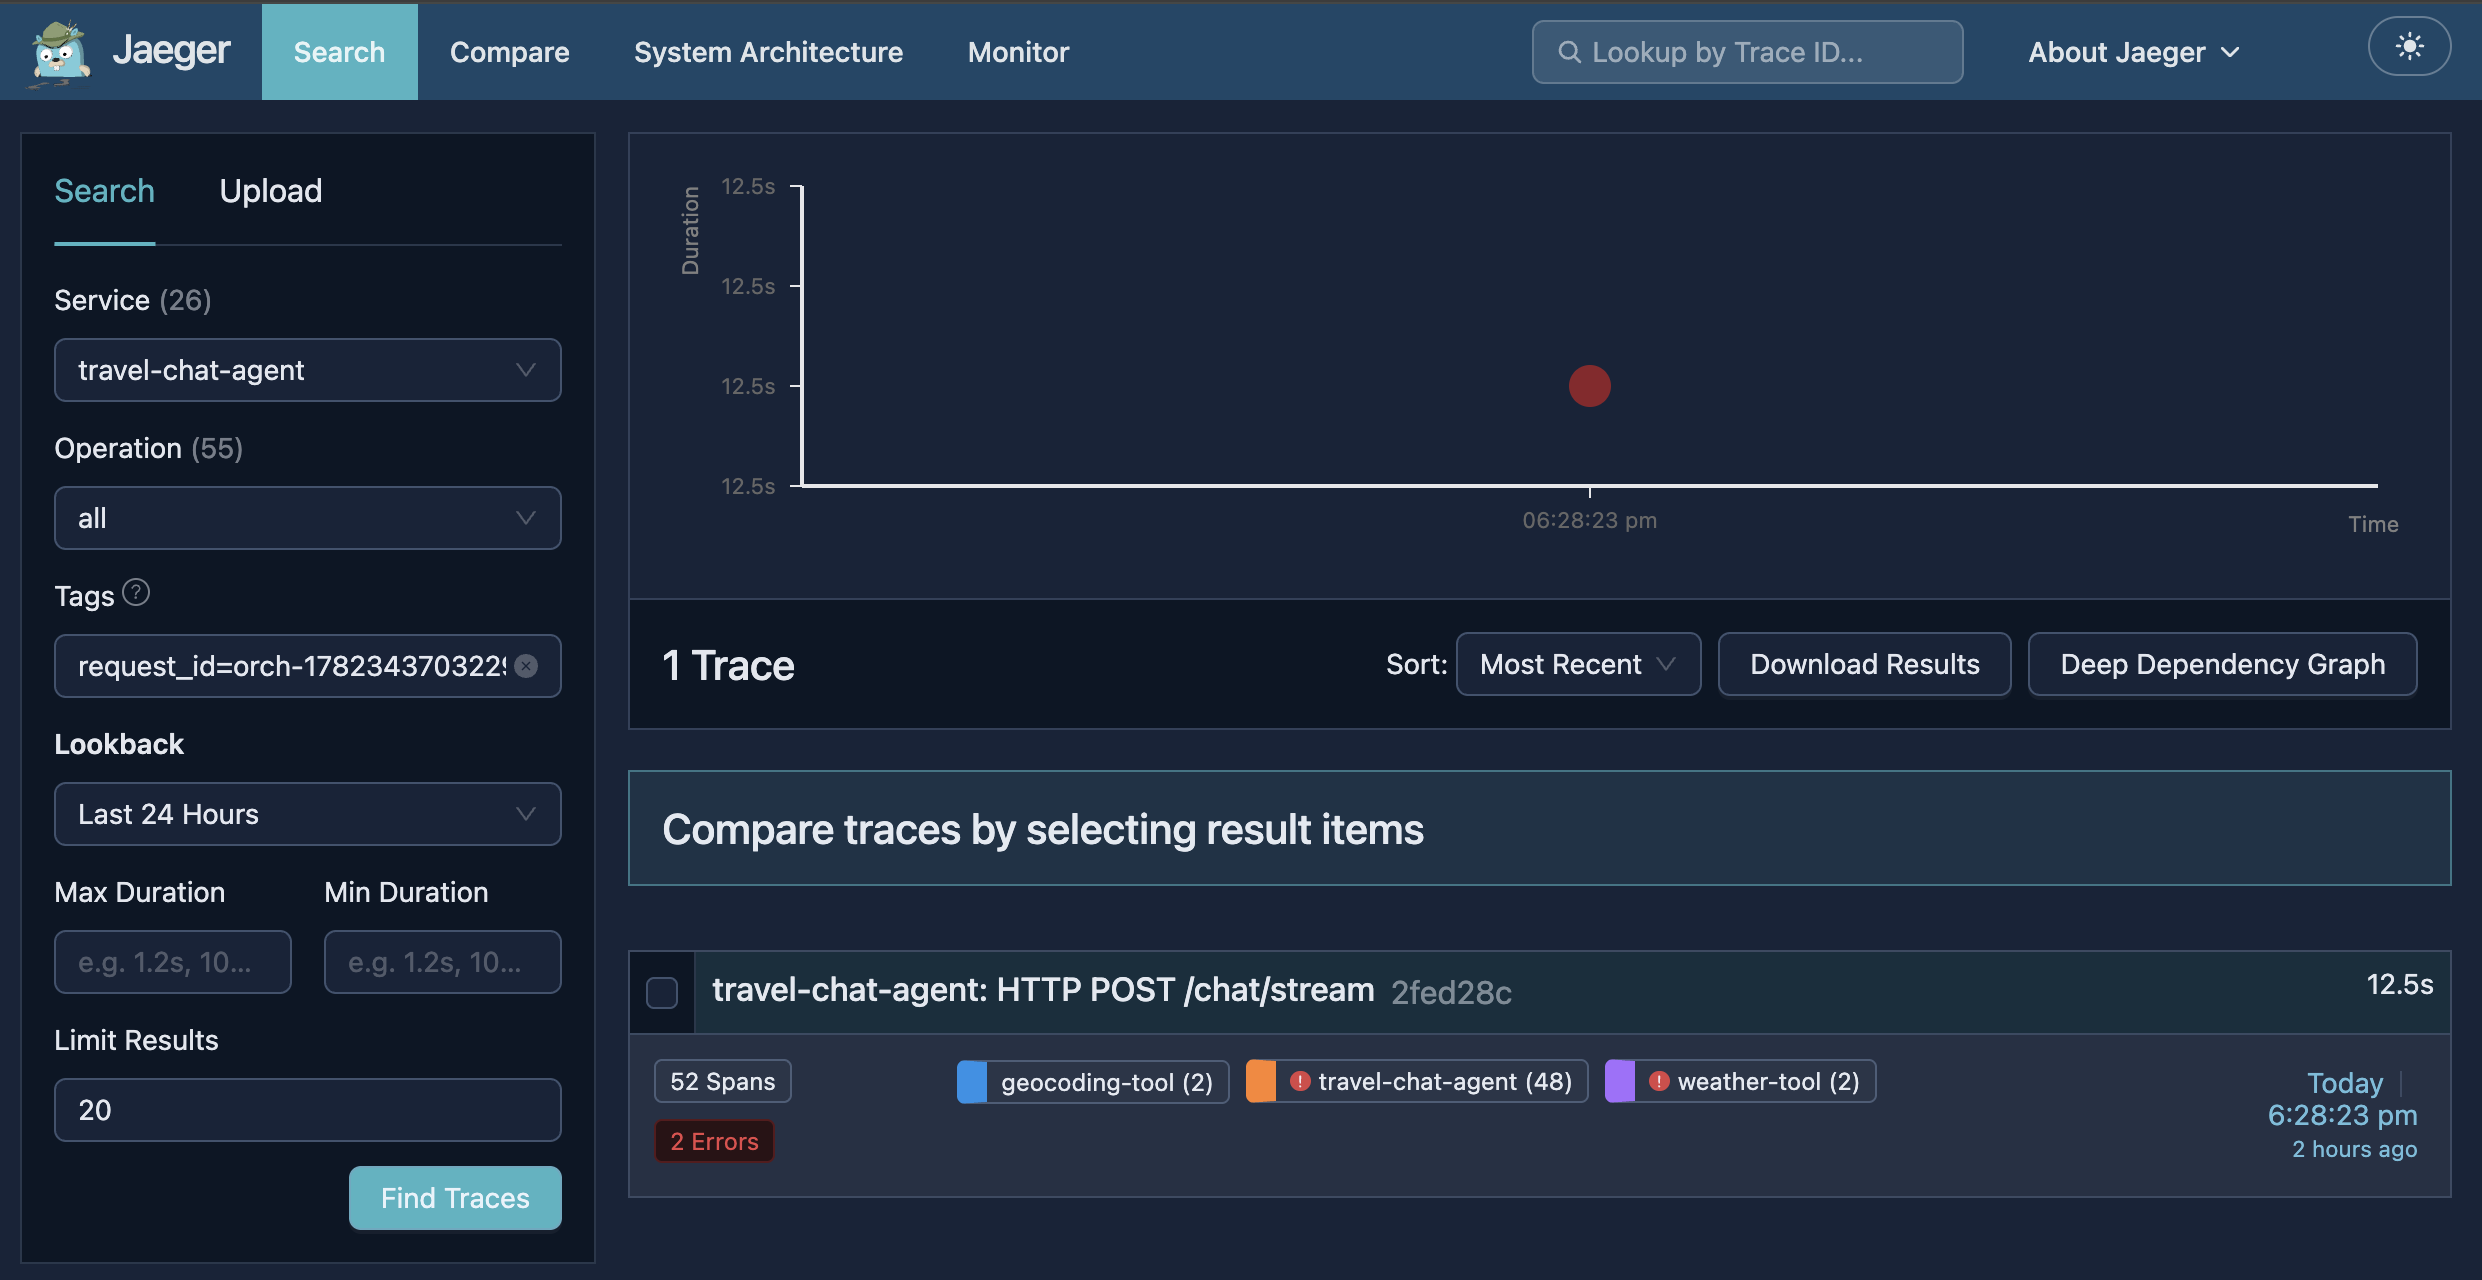
request_id, pasted into Jaeger's Tags filter and scoped to travel-chat-agent, returns exactly one trace — HTTP POST /chat/stream, 52 spans, and a red 2 Errors badge that is the first hint the "clean" answer was anything but. The per-service split on that row previews the shape to come: travel-chat-agent 48 spans, geocoding-tool 2, weather-tool 2.Open that trace and the eleven seconds resolve into 52 spans arranged in a tree eight levels deep, spanning the agent and the two tools it called. The root span is the HTTP request itself — HTTP POST /chat/stream — and everything the agent did to answer it hangs underneath. Drawn to scale, the run looks like this:
Read top to bottom, the shape is the agent's reasoning loop. A memory-enrichment hook runs first, recalling what the system already knows about the user. Then phase.1 opens, and inside it the model is consulted twice: once to pick which tools from the catalog are relevant (tiered_selection), once to write an executable plan (plan_generation). The plan's two steps then run — step-1 geocodes "Tokyo" to coordinates, step-2 fetches the weather — and a final synthesis streams the answer. The whole thing is plan-act-observe[3], made of spans.
This is the same trace as a real Jaeger window; the structure above is just the readable version of it.
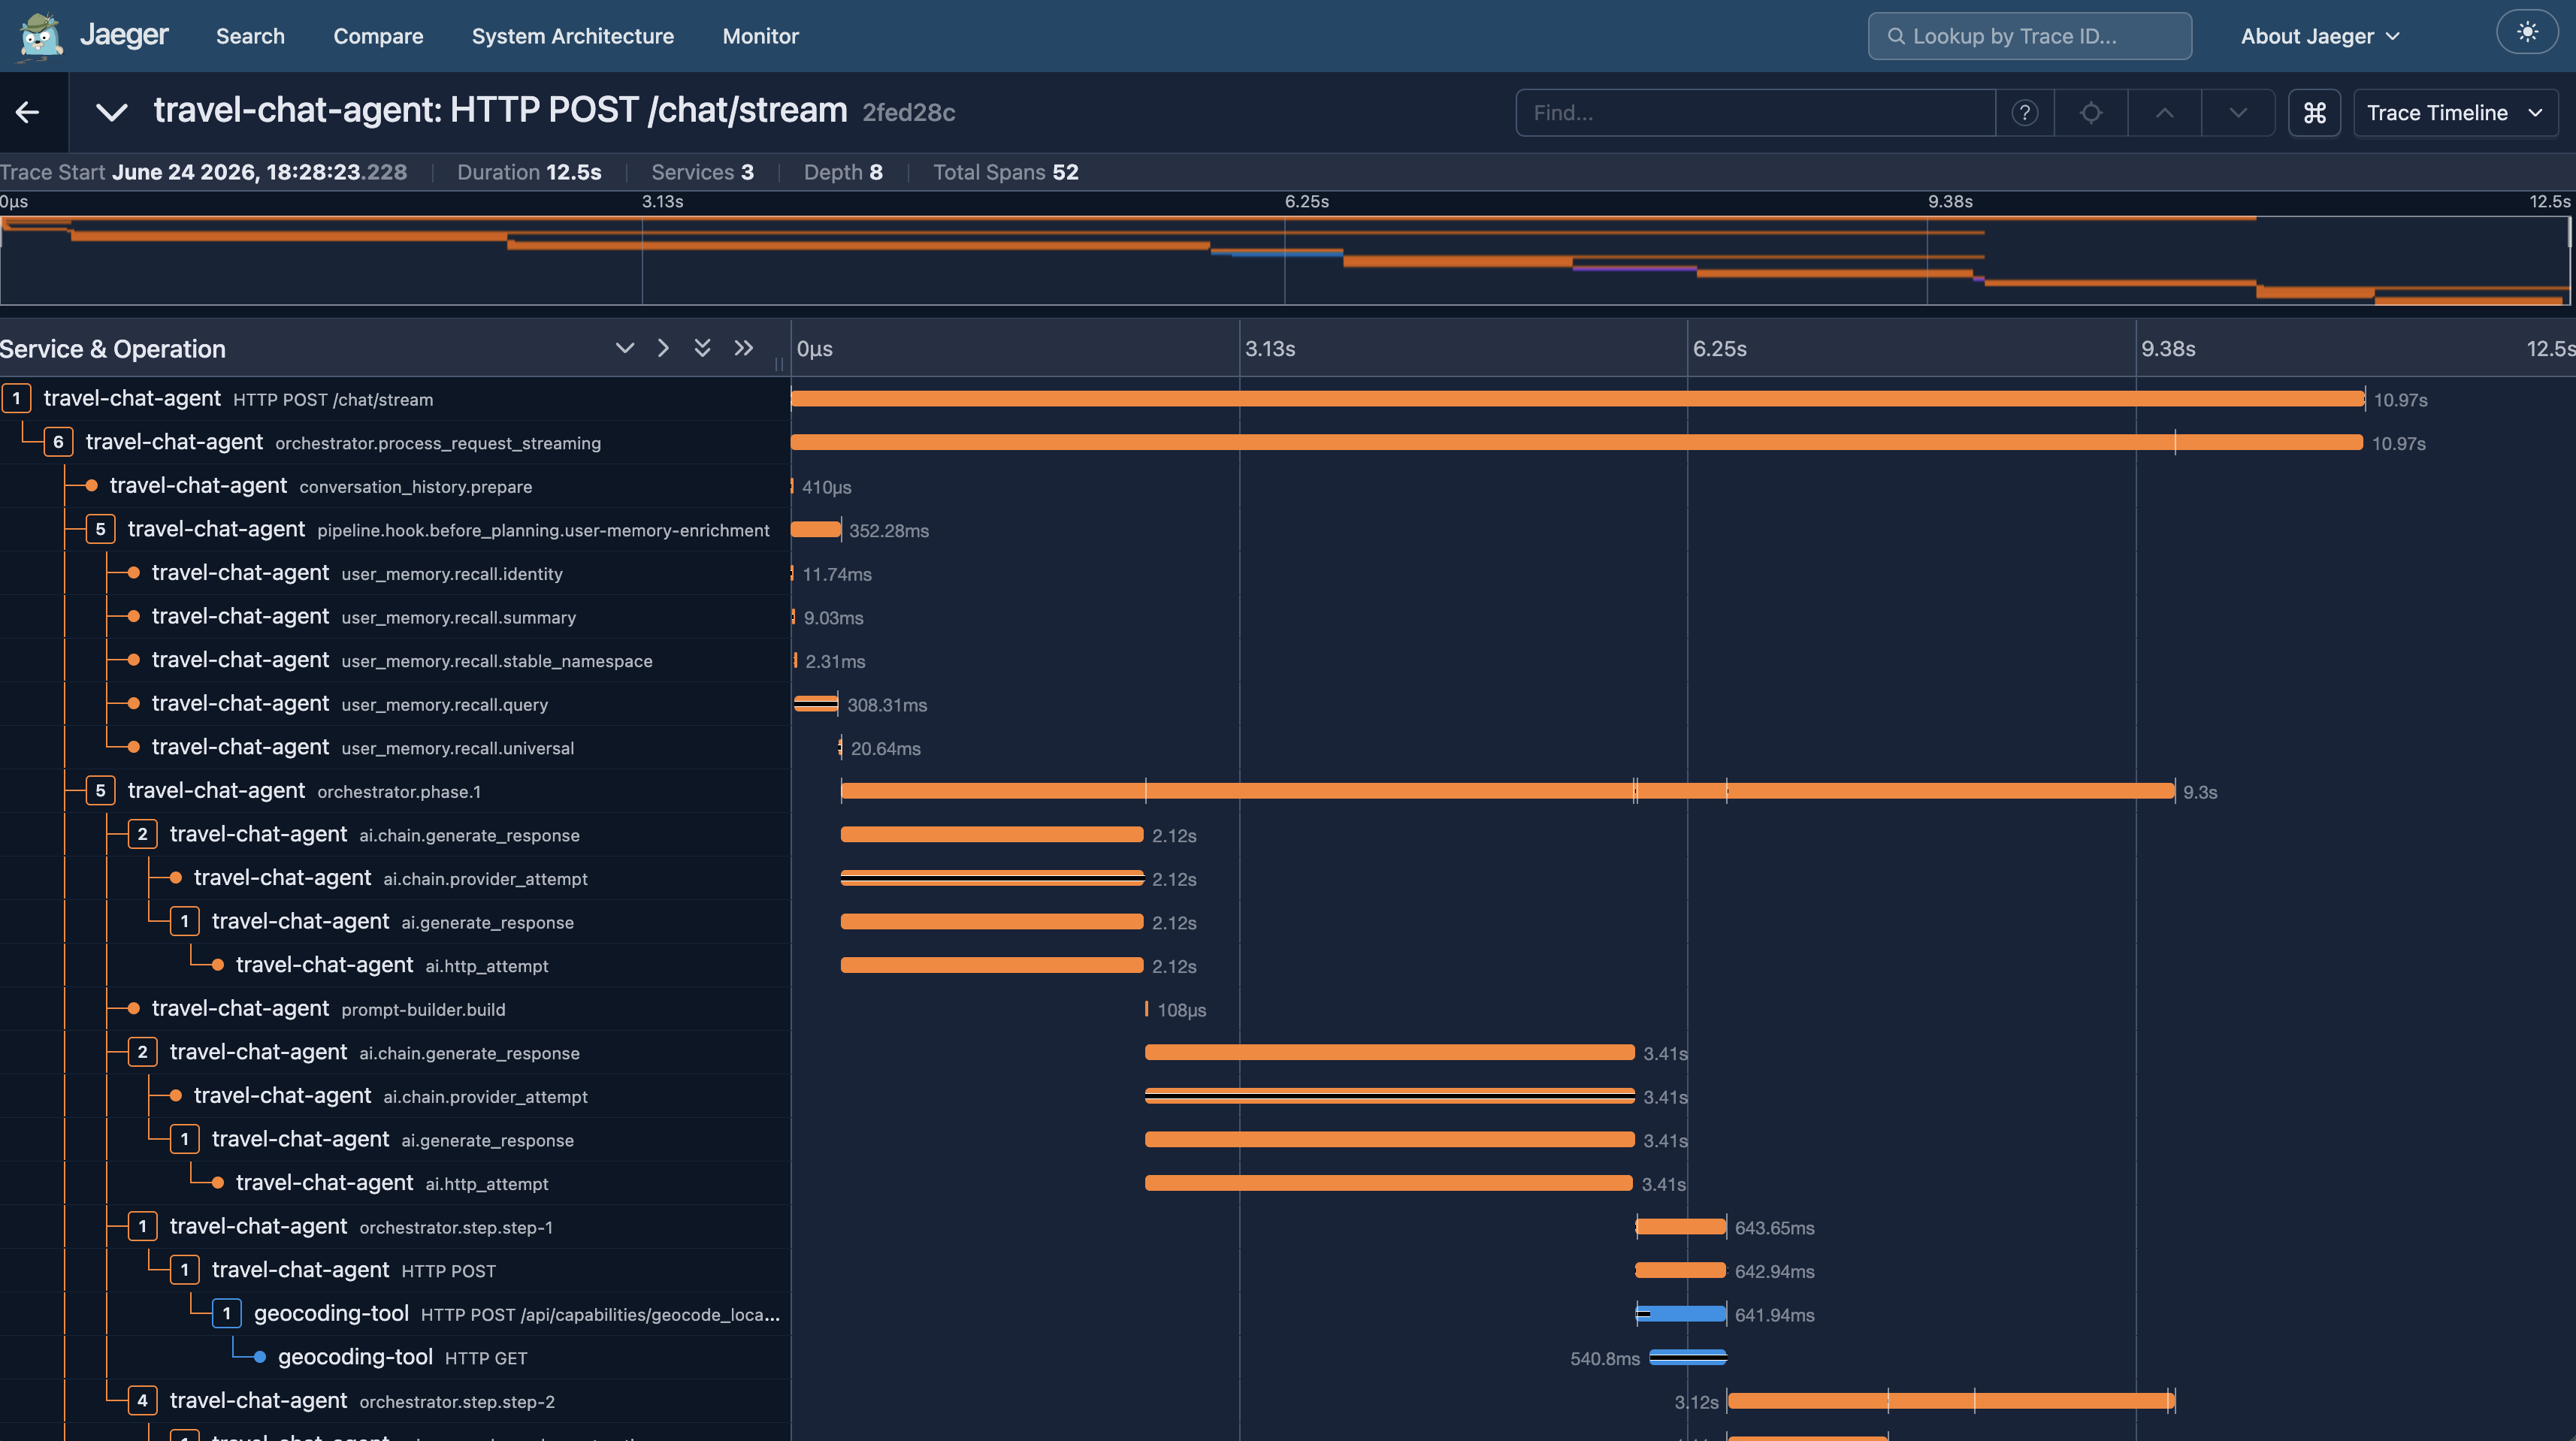
ai.chain.generate_response decomposes into a provider attempt and an HTTP attempt, so retries and provider fallbacks would show up here as additional child spans — the trace is granular enough to see a single model call's internal structure.Two details in that tree are worth pausing on, because they are exactly the things a flat "2 tools, 11s" summary erases. The memory hook's user_memory.recall.query span took 308 milliseconds while its four sibling recalls took 2 to 20 milliseconds each — a tenfold outlier hiding inside the 350-millisecond hook. And the entire after_synthesis memory-extraction hook runs past the moment the user got their answer. Neither is a bug. Both are invisible without the trace, and we will see the logs explain the first one outright.
One mechanism deserves a name, because it is what lets a single trace span three separate services at all. When the agent calls a tool, the request leaves through a traced HTTP client that injects a W3C traceparent header — 00-<trace_id>-<span_id>-<flags> — onto the wire[11]. Each tool, in turn, wraps its handlers in a tracing middleware that reads that header and continues the same trace instead of starting a fresh one[19]. That is the whole trick — no sidecar, no service mesh, no proprietary protocol; the trace rides on the ordinary HTTP these services already speak, which is why geocoding-tool and weather-tool appear as branches of the agent's tree rather than as three disconnected traces. The orchestrator also stamps request_id onto the span as the request enters, which is exactly what made the Jaeger Tags lookup in Figure 3 possible.
Reading a single LLM span
Click any of the purple bars and the span opens. Because TruvaG3 tags LLM calls with the Gen-AI semantic conventions, the panel is not a generic "internal span" — it is a structured record of an inference. Here is the plan_generation span, the call where the model wrote the two-step plan, reduced to its attributes:
span: ai.generate_response          duration: 3.41s
  ai.purpose            = plan_generation
  ai.model              = gpt-4.1-2025-04-14
  ai.provider           = openai
  ai.prompt_tokens      = 2587
  ai.completion_tokens  = 225
  ai.total_tokens       = 2812
  ai.finish_reason      = stop
  ai.temperature        = 0.3
  request_id            = orch-1782343703229248038
otel.scope.name = truvag3-telemetryThis is the layer of telemetry that is always on. Every model call in the run carries it, which means questions that are painful to answer in most agent stacks — which call burned the most tokens? which model served it? did any call get truncated rather than finishing cleanly? — are already answered, per span, in the trace. The ai.purpose attribute is the small touch that makes it navigable: instead of a wall of identical "LLM call" spans, you get labels like tiered_selection, plan_generation, and synthesis_streaming — most calls tagged with the job they were doing. (Two model calls in this run — the micro-resolution and the error-analysis behind the recovery — carry no ai.purpose of their own; the registry-viewer names them in Lens Two.)
Spans also carry events — timestamped structured logs attached to the span itself. The orchestrator.phase.1 span, for instance, records the planning sequence inline: tiered_selection.request and tiered_selection.response, then plan_generation.request with the literal instruction it sent the model ("Create a JSON execution plan to fulfill the user's request"), then plan_execution.started and plan_execution.completed. The trace is not just a timing diagram; it is a narrated one. And the most narrated span in this run is the one we have been circling: step-2.
The failure you didn't see
Step-2 is the weather call. On the waterfall it is a 3.1-second teal bar — more than four times longer than the geocoding step above it. A flat summary would shrug: weather APIs are slow. The trace tells a different story. Zoom in on what happened inside that single step:
The sequence is a complete act-observe-recover loop, and every stage of it is a real span or span event:
- Resolve. The weather tool needs a
location. Amicro_resolver.value_extractioncall asks the model to pull it from the previous step's geocoding output, and the model returns the coordinates verbatim:{"location": "35.6768601,139.7638947", "units": "metric"}. - Act, and fail. The agent POSTs those coordinates to the weather tool. It comes back
404. The tool did not fail silently or throw an opaque 500 — it returned a structured, retryable error, which is the contract that makes the next step possible:{"success": false, "error": { "code": "LOCATION_NOT_FOUND", "category": "NOT_FOUND", "retryable": true, "message": "Location '35.6768601,139.7638947' not found...", "details": { "hint": "OpenWeatherMap expects 'City, Country' format (e.g., 'London, UK')" } }} - Observe. The orchestrator does not blindly retry the same request. It hands the failure to an
error_analysismodel call, which reads the error and returns a judgment:{"should_retry": true, "reason": "The error indicates that the API does not support coordinates in the 'location' parameter and expects a 'City, Country' format (e.g., 'Tokyo, JP').", "suggested_changes": { "location": "Tokyo, JP" }, "is_transient_error": false} - Recover. The agent rewrites
locationto"Tokyo, JP"and POSTs again.200, in 55 milliseconds. The weather comes back, and the run continues as if nothing had happened.
The registry-viewer shows this same recovery from the agent's own vantage point — the error_analysis · step-2 call sitting in the run's LLM activity, right between the micro-resolution and the synthesis:
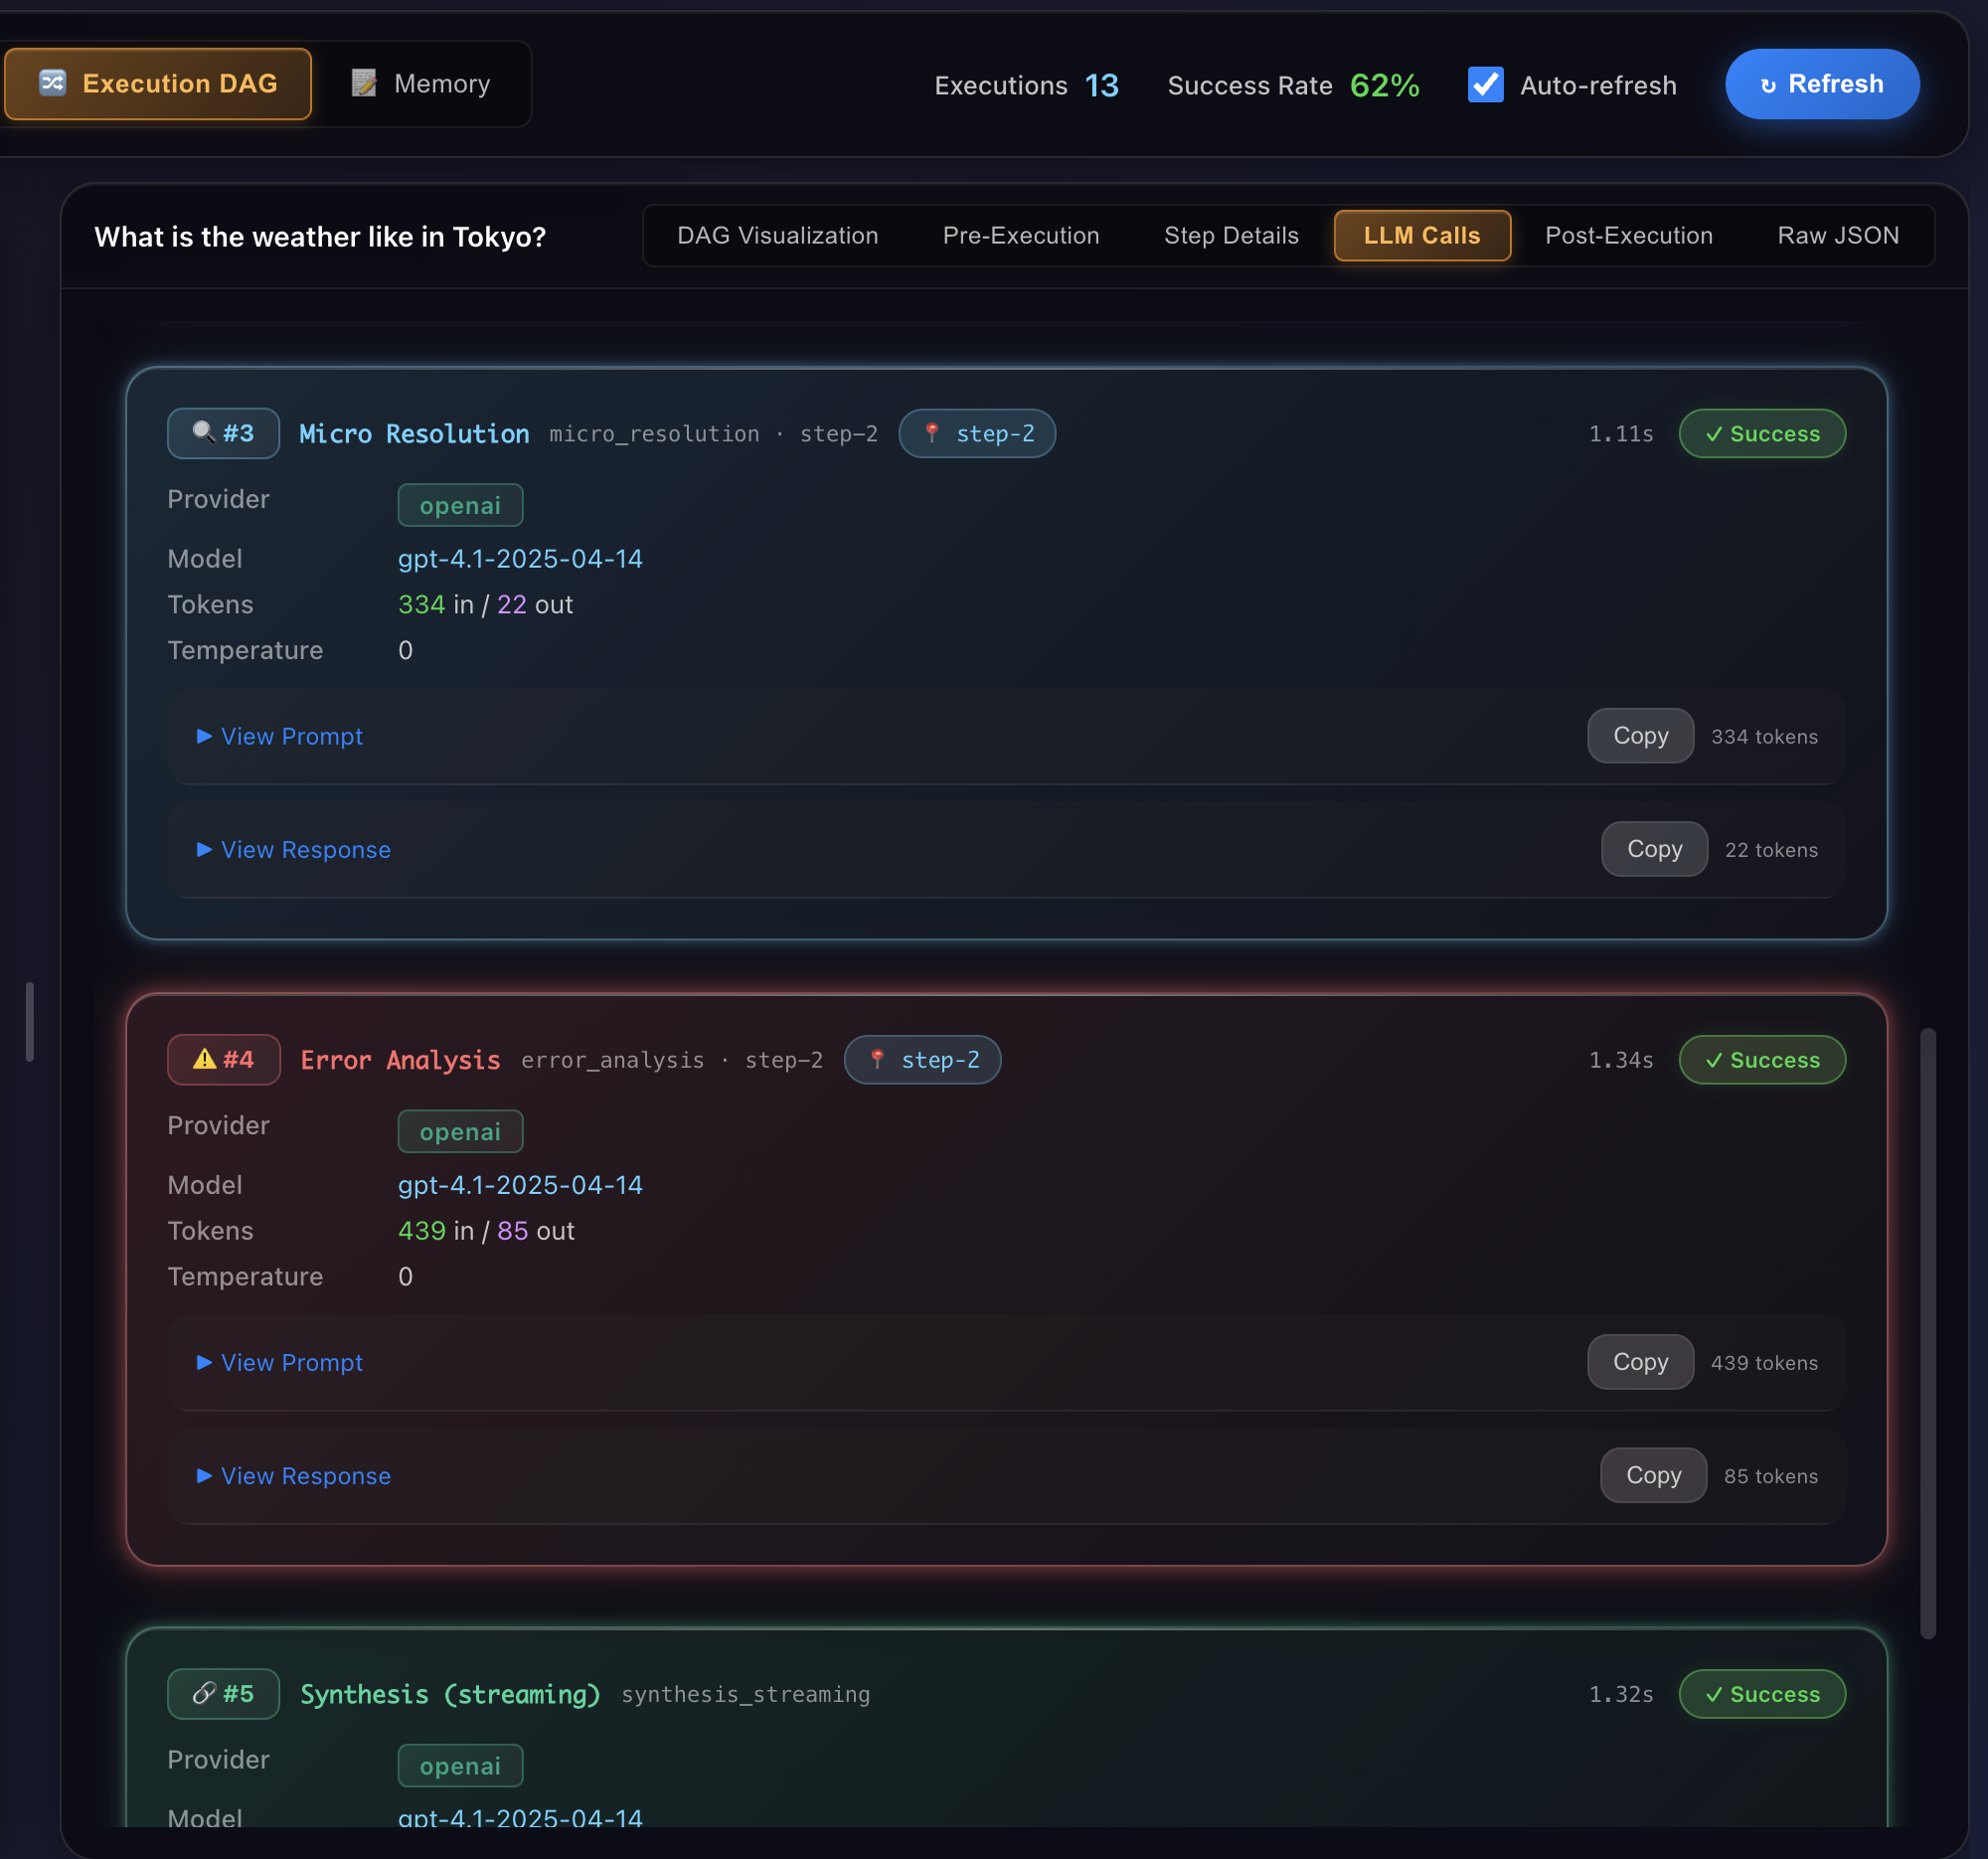
error_analysis call (#4), attached to step-2, with its own prompt, response, and 439-in / 85-out token cost. The framework treats "figure out why the tool failed" as a first-class, observable step — not a hidden retry.Now the most important detail. Look back at the step-2 envelope in Figure 7: attempts = 1. The execution record will report this step as a single successful attempt, because from the plan's point of view it was — the recovery happened inside one step attempt, not as a re-run of the step. Two HTTP POSTs to the weather tool appear in the trace; one of them is a 404; the step-level counter still reads one. This is a perfect, small example of why you need more than one surface: the user-facing answer says "success," the execution record says "1 attempt, success," and only the trace and the logs reveal that "success" required the agent to catch its own mistake and correct it. A system that only showed you the top line would have taught you nothing about a failure mode that, on a different day with a less forgiving tool, could have surfaced to the user.
Pillar three: the logs, already correlated
The trace tells you where and when. Logs tell you what and why, in the words of the code that ran. The third pillar matters only if you can get from a suspicious span to its logs without guessing — and that is precisely what the shared correlation identifier buys you. Every one of the 106 log lines this request emitted carries the same trace_id and the span_id of the exact span it belongs to.
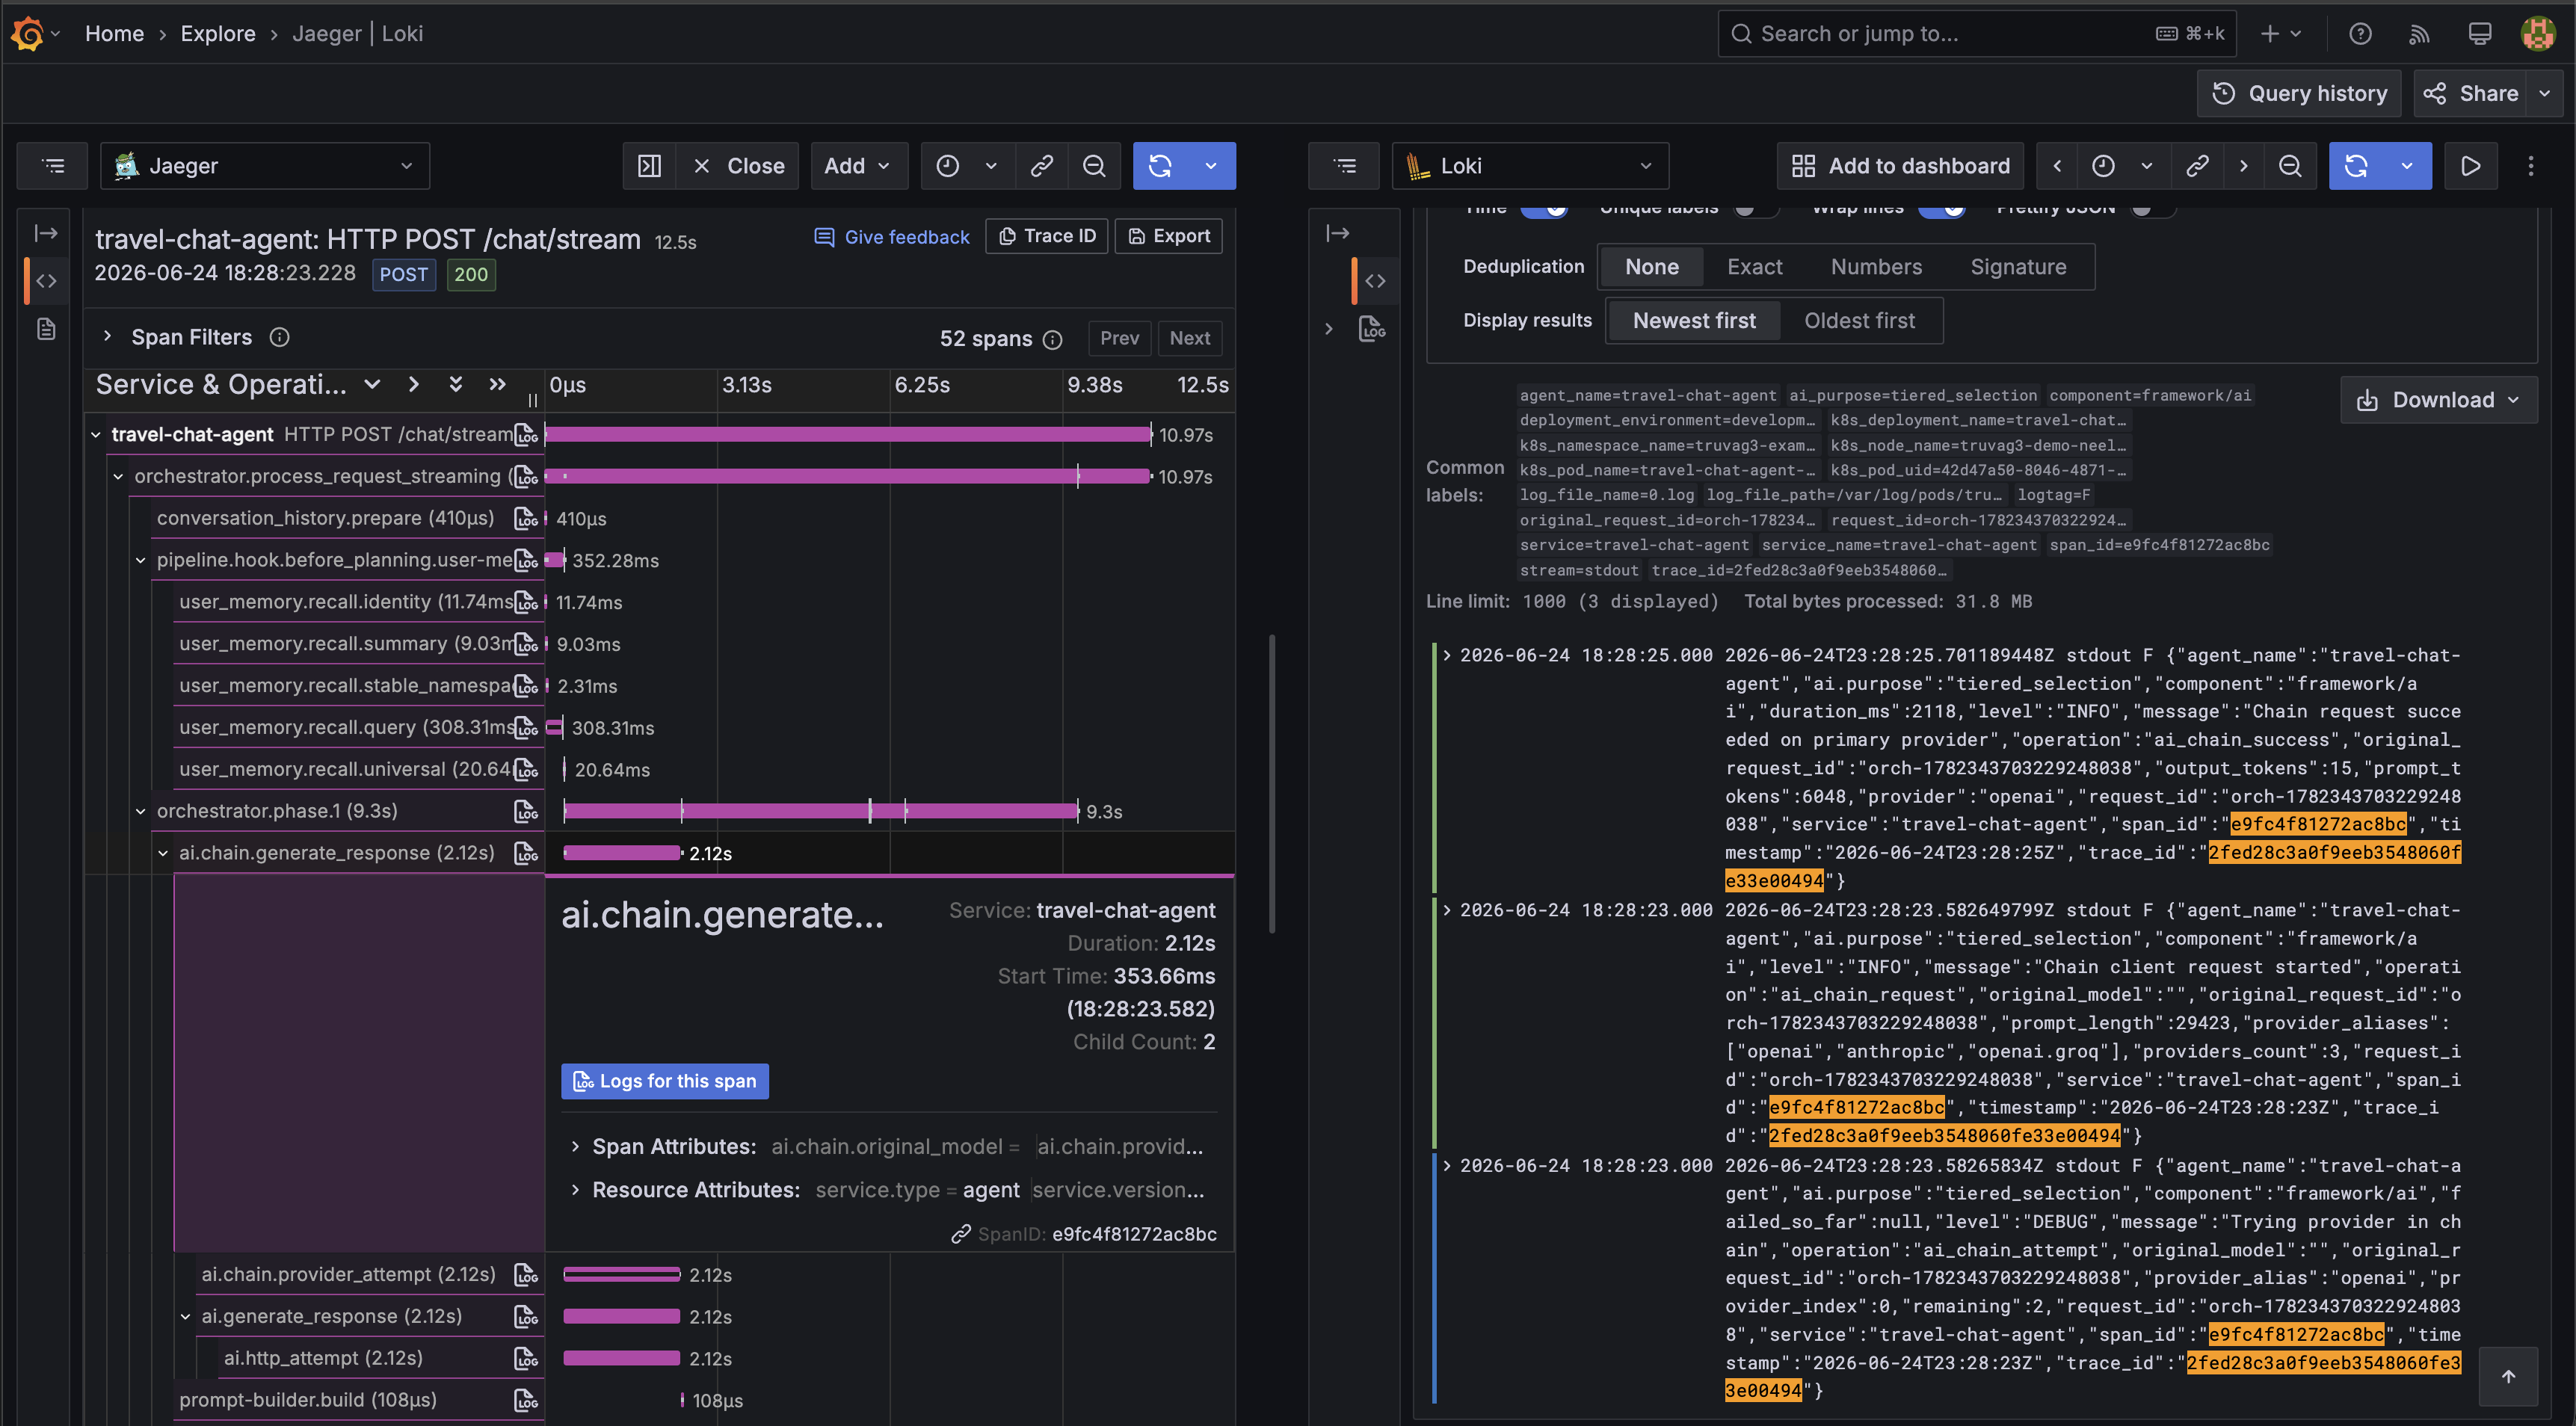
trace_id as a label, so selecting a span in Jaeger and asking for "logs for this span" pulls the log lines that share its trace_id. Traces and logs are not two separate haystacks here; they are two indexes over the same events.The log lines are structured JSON, not prose, so they aggregate and filter like data. Across this one request, those 106 lines break down into 50 INFO, 47 DEBUG, 7 WARN, and 2 ERROR, emitted by six components — among them framework/orchestration, framework/ai, tool/weather-tool, agent/travel-chat-agent, and framework/memory. And the failure we have been tracking surfaces here for the third time, now in plain language, on the weather tool's own span:
level=ERROR  component=tool/weather-tool  span_id=f7ee82cf…
  msg="Weather API call failed - returning structured error"
level=WARN   component=tool/weather-tool  span_id=f7ee82cf…  duration_ms=602
  msg="HTTP request client error"     status=404
level=ERROR  component=tool/weather-tool  span_id=f7ee82cf…
  msg="OpenWeatherMap API returned error"
⋯ trace_id=2fed28c3a0f9eeb3548060fe33e00494 (on every line)error_analyzer.* events on step-2's span, and now as ERROR/WARN log lines on the tool itself. Three pillars, one failure, stitched by one trace_id.The logs also answer the question the trace only raised. Remember the 308-millisecond recall.query span — the tenfold outlier in the memory hook? Among the seven WARN lines is this one, repeated for several recall categories:
level=WARN  component=framework/memory  operation=user_memory_recall_by_category
  msg="User memory recall by category missing created_at index,
       falling back to unsorted scroll"
That is the whole diagnosis. The slow recall was slow because a Redis index was missing and the query fell back to an unsorted scroll. The trace showed you which span was slow; the log, correlated to it, tells you why and what to fix. This is the three-pillar payoff in miniature: no single signal was sufficient, but together they took us from "350 ms hook" to "add the created_at index." The logs carry one more operational detail worth noting — each model call records the provider chain it tried (["openai", "anthropic", "openai.groq"]), so a provider failover would be visible as a fallback down that list rather than as an unexplained latency spike.
And the pivot between pillars is itself a one-liner. Selecting a span in Jaeger and clicking through to logs runs nothing more exotic than the trace ID against the log stream — in Grafana's LogQL, {service="travel-chat-agent"} |= "2fed28c3a0f9eeb3548060fe33e00494"[19]. Whichever identifier you happen to be holding, you can always reach the other two:
| If you have… | …reach the request by |
|---|---|
request_id — the chat footer (Figure 2) or any API response | Jaeger Tags search: request_id=<value> |
trace_id — any log line or span | Direct trace URL, or Loki |= "<trace_id>" |
| only "something failed" | Jaeger tag error=true, then read that span's events and correlated logs |
Lens two: the agent-native view
Everything so far came from generic, vendor-neutral infrastructure — Jaeger, Loki, OpenTelemetry — and it took us a remarkably long way. But there is a ceiling to what span-and-log tracing can show, and it is a structural one: a trace records operations, not intentions. It can show you that plan_generation ran for 3.4 seconds and emitted 225 tokens. It cannot, by itself, show you the plan. For that, TruvaG3 ships a second lens — the registry-viewer's Execution DAG[6], a view built specifically around the agent's reasoning, reading from an execution debug store rather than the trace backend. It opens on the run as a graph.
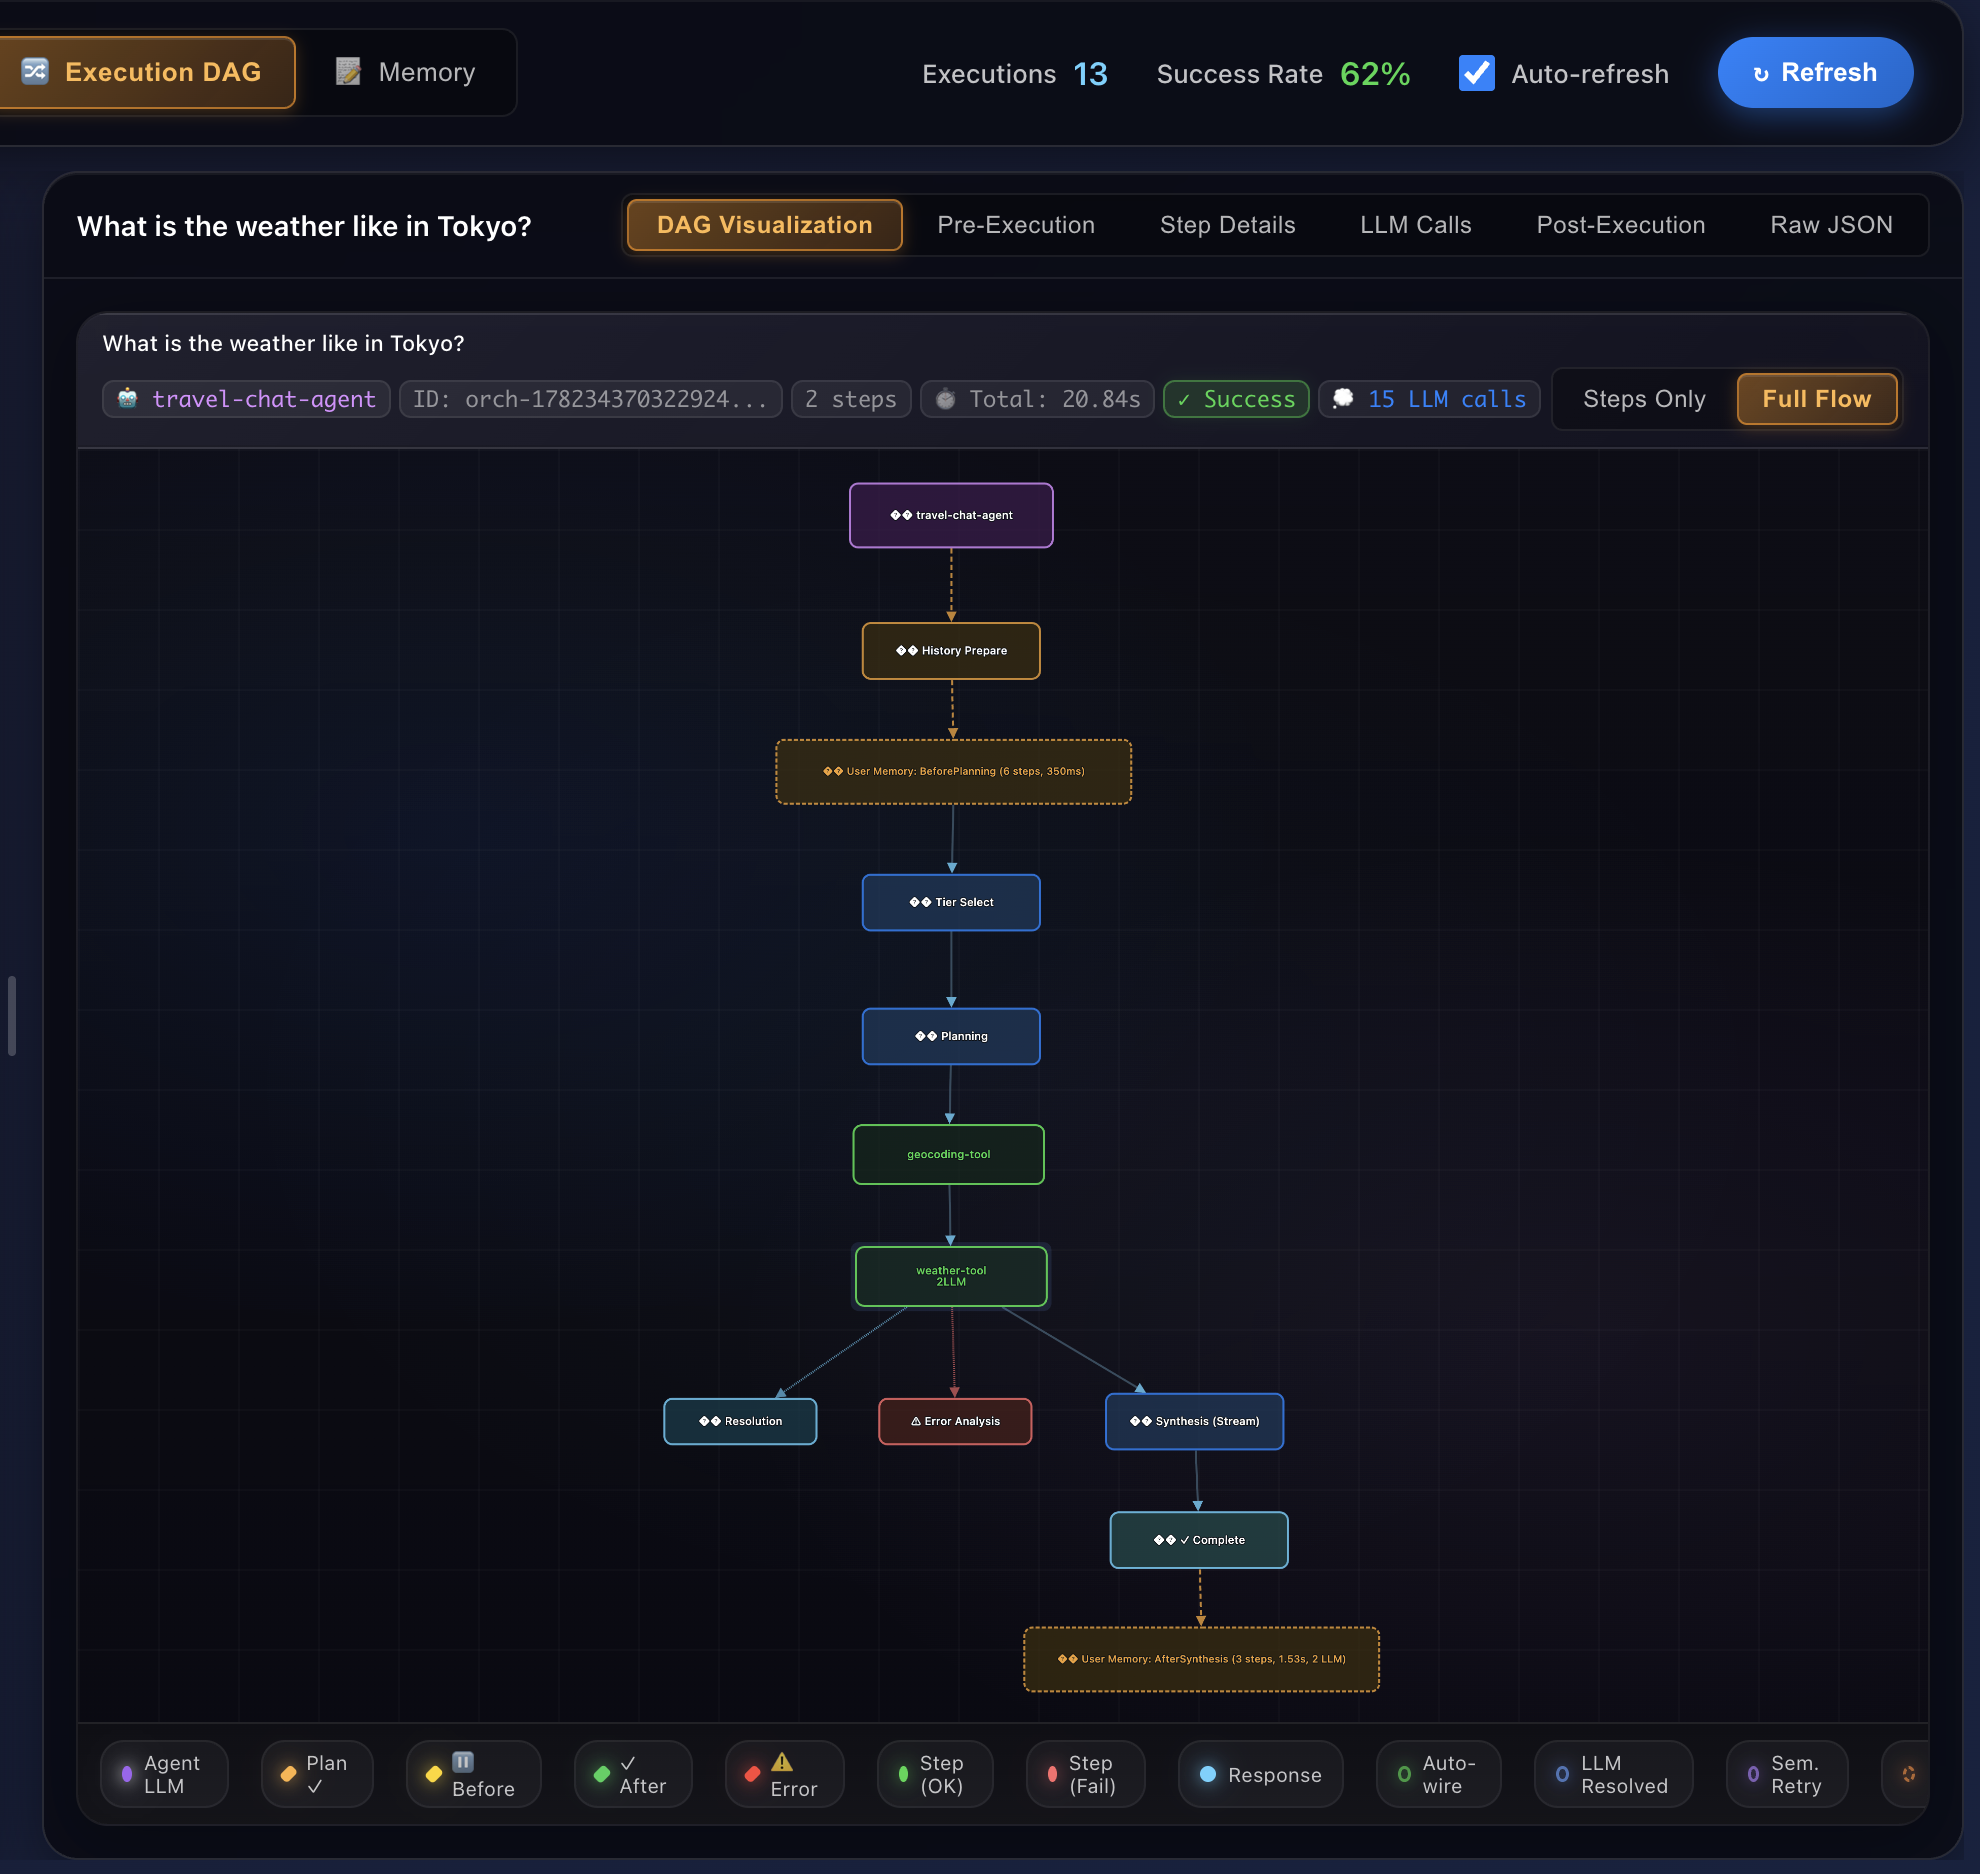
The view has a tab for each phase of the agent's lifecycle. Walking them in order is the most complete way to understand the run, because each one surfaces a layer the trace abstracts away.
Pre-Execution: what the agent knew before it planned
Before the model writes a plan, the orchestrator runs memory hooks — the amber span at the very top of the trace. The Pre-Execution tab shows what those hooks actually did: a short sequence of memory operations — five recall lookups plus an enrichment step — completing in 350 milliseconds, ending by injecting what it found into the planning context.
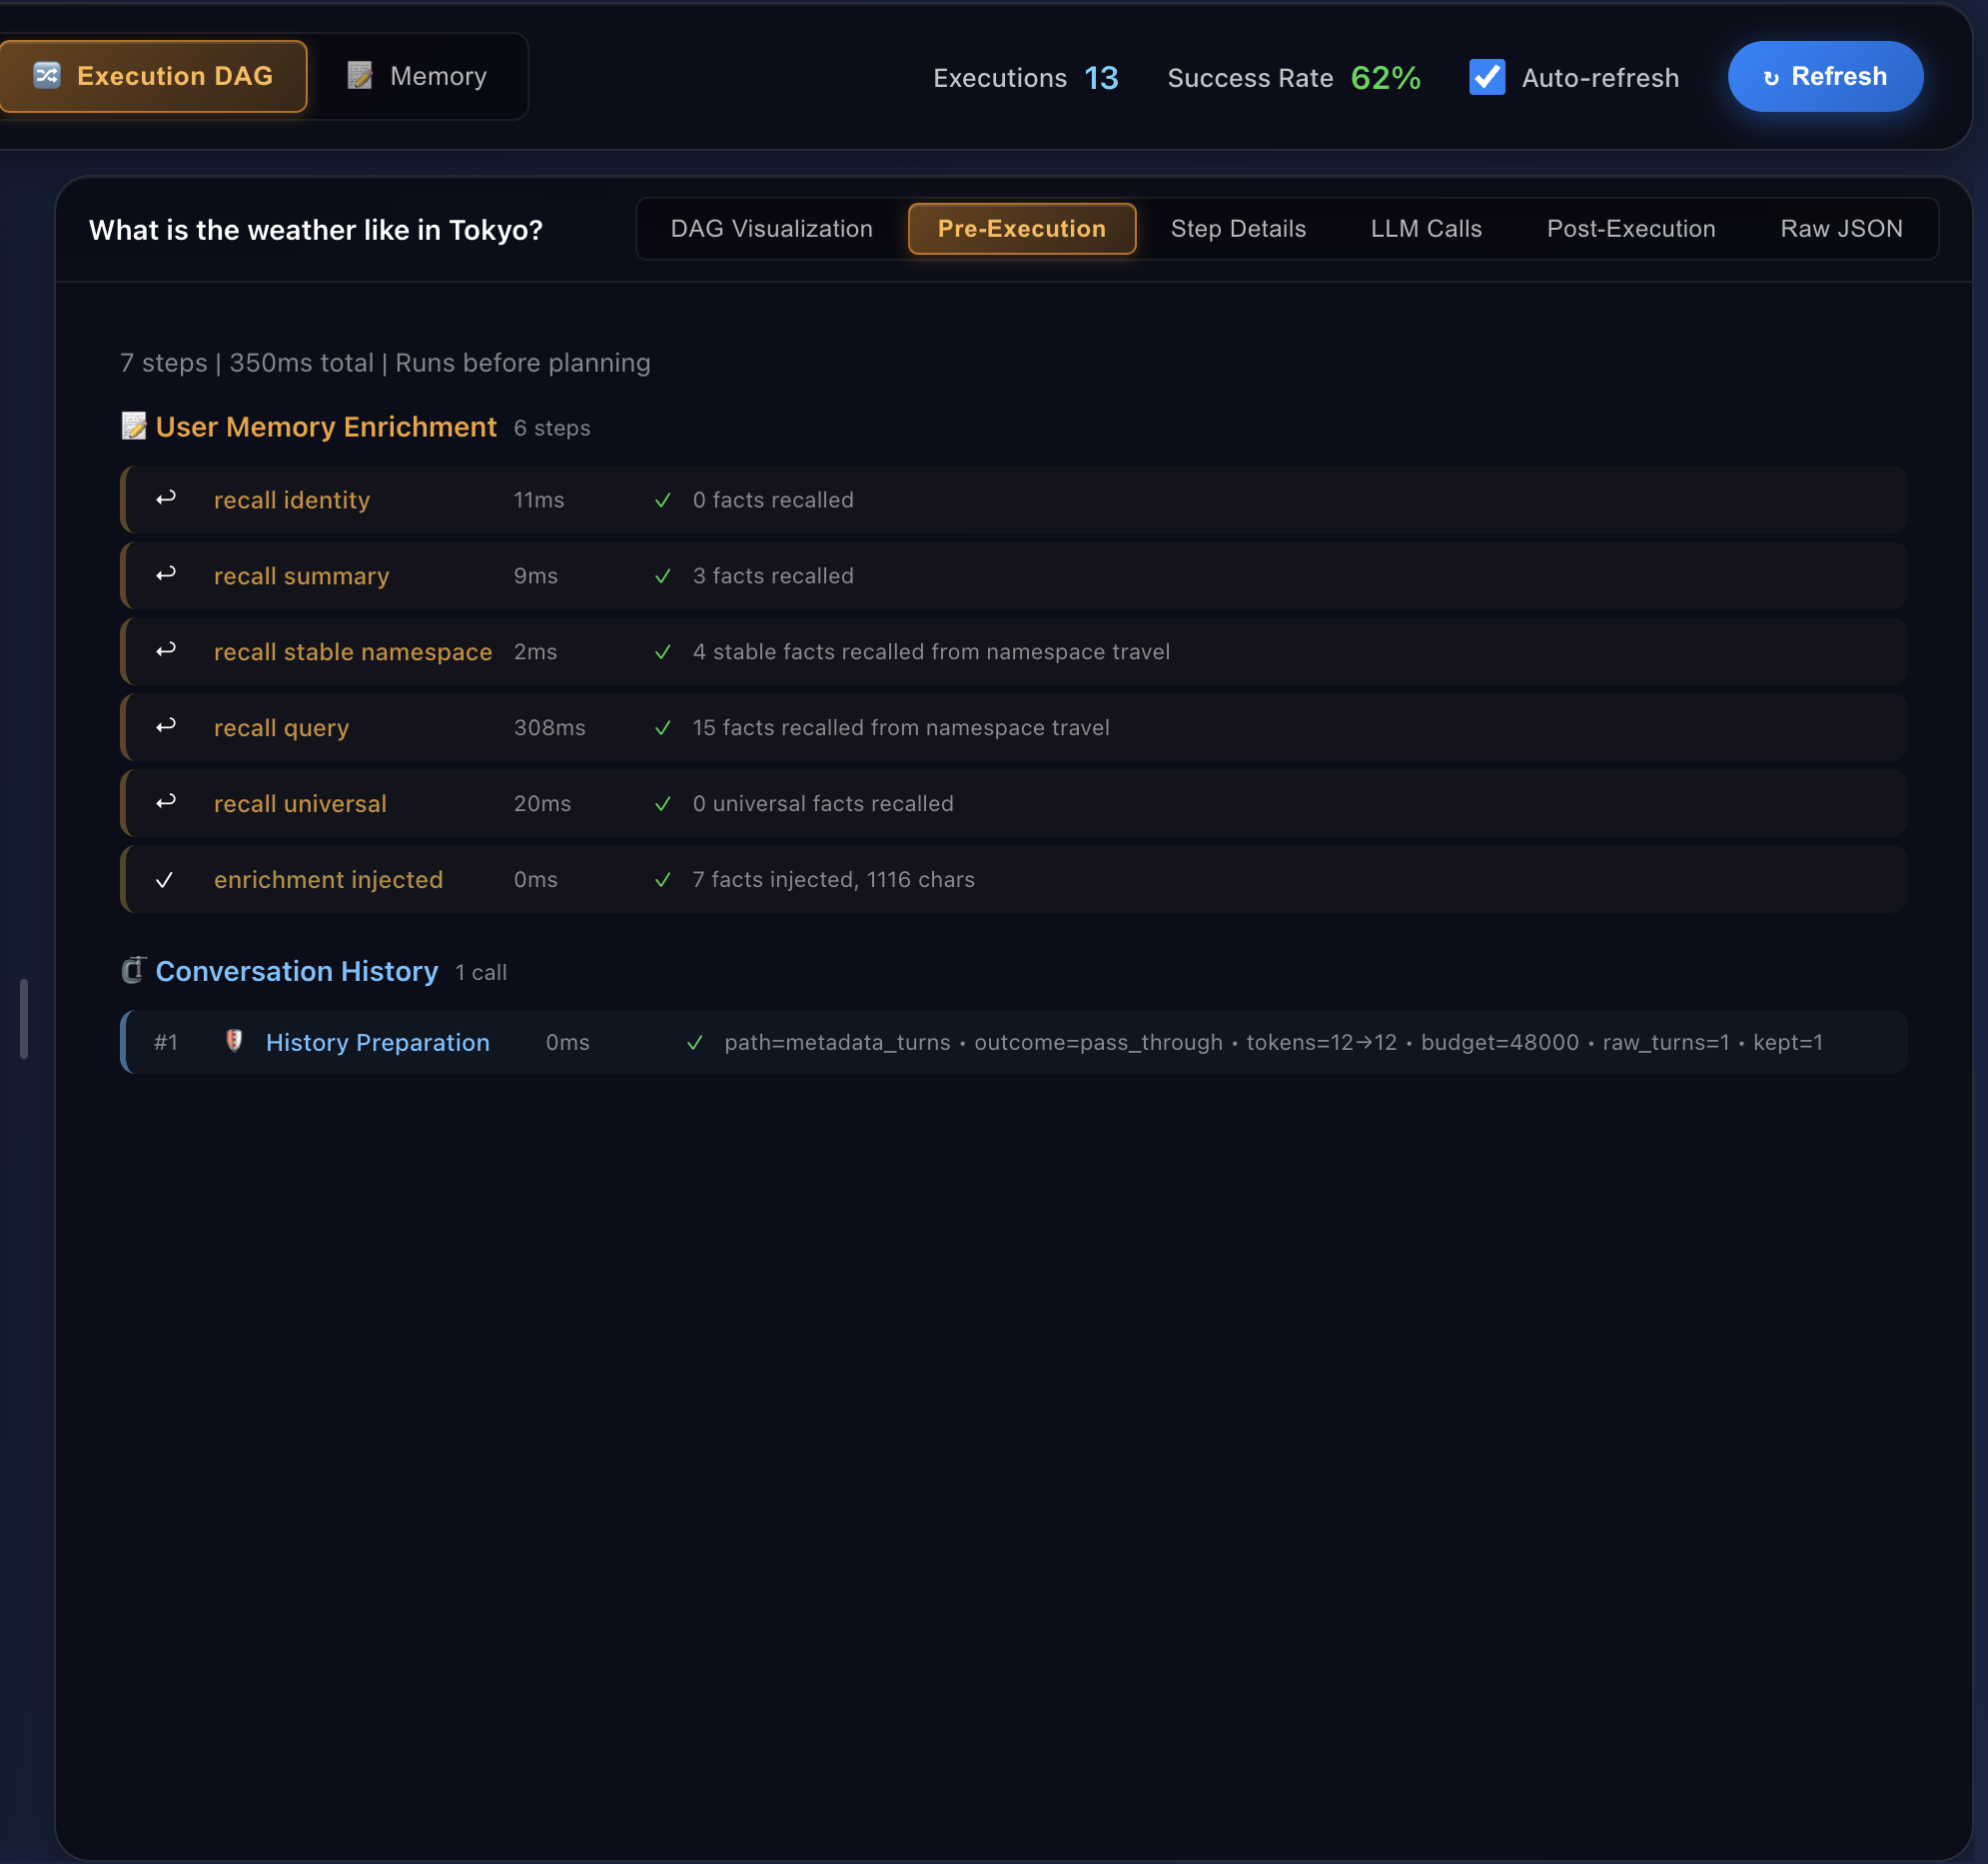
travel namespace, seven of them injected (1,116 characters) into the planning prompt. The 308-millisecond recall query is right here — the same outlier the trace flagged and the logs explained. This is the layer where the agent's "context" stops being a black box.Step Details: the plan, executed
The Step Details tab is the per-step ledger: each plan step with its tool, its instruction, its parameters, its duration, and — crucially — its resolution, the record of how the step's parameters got filled in.
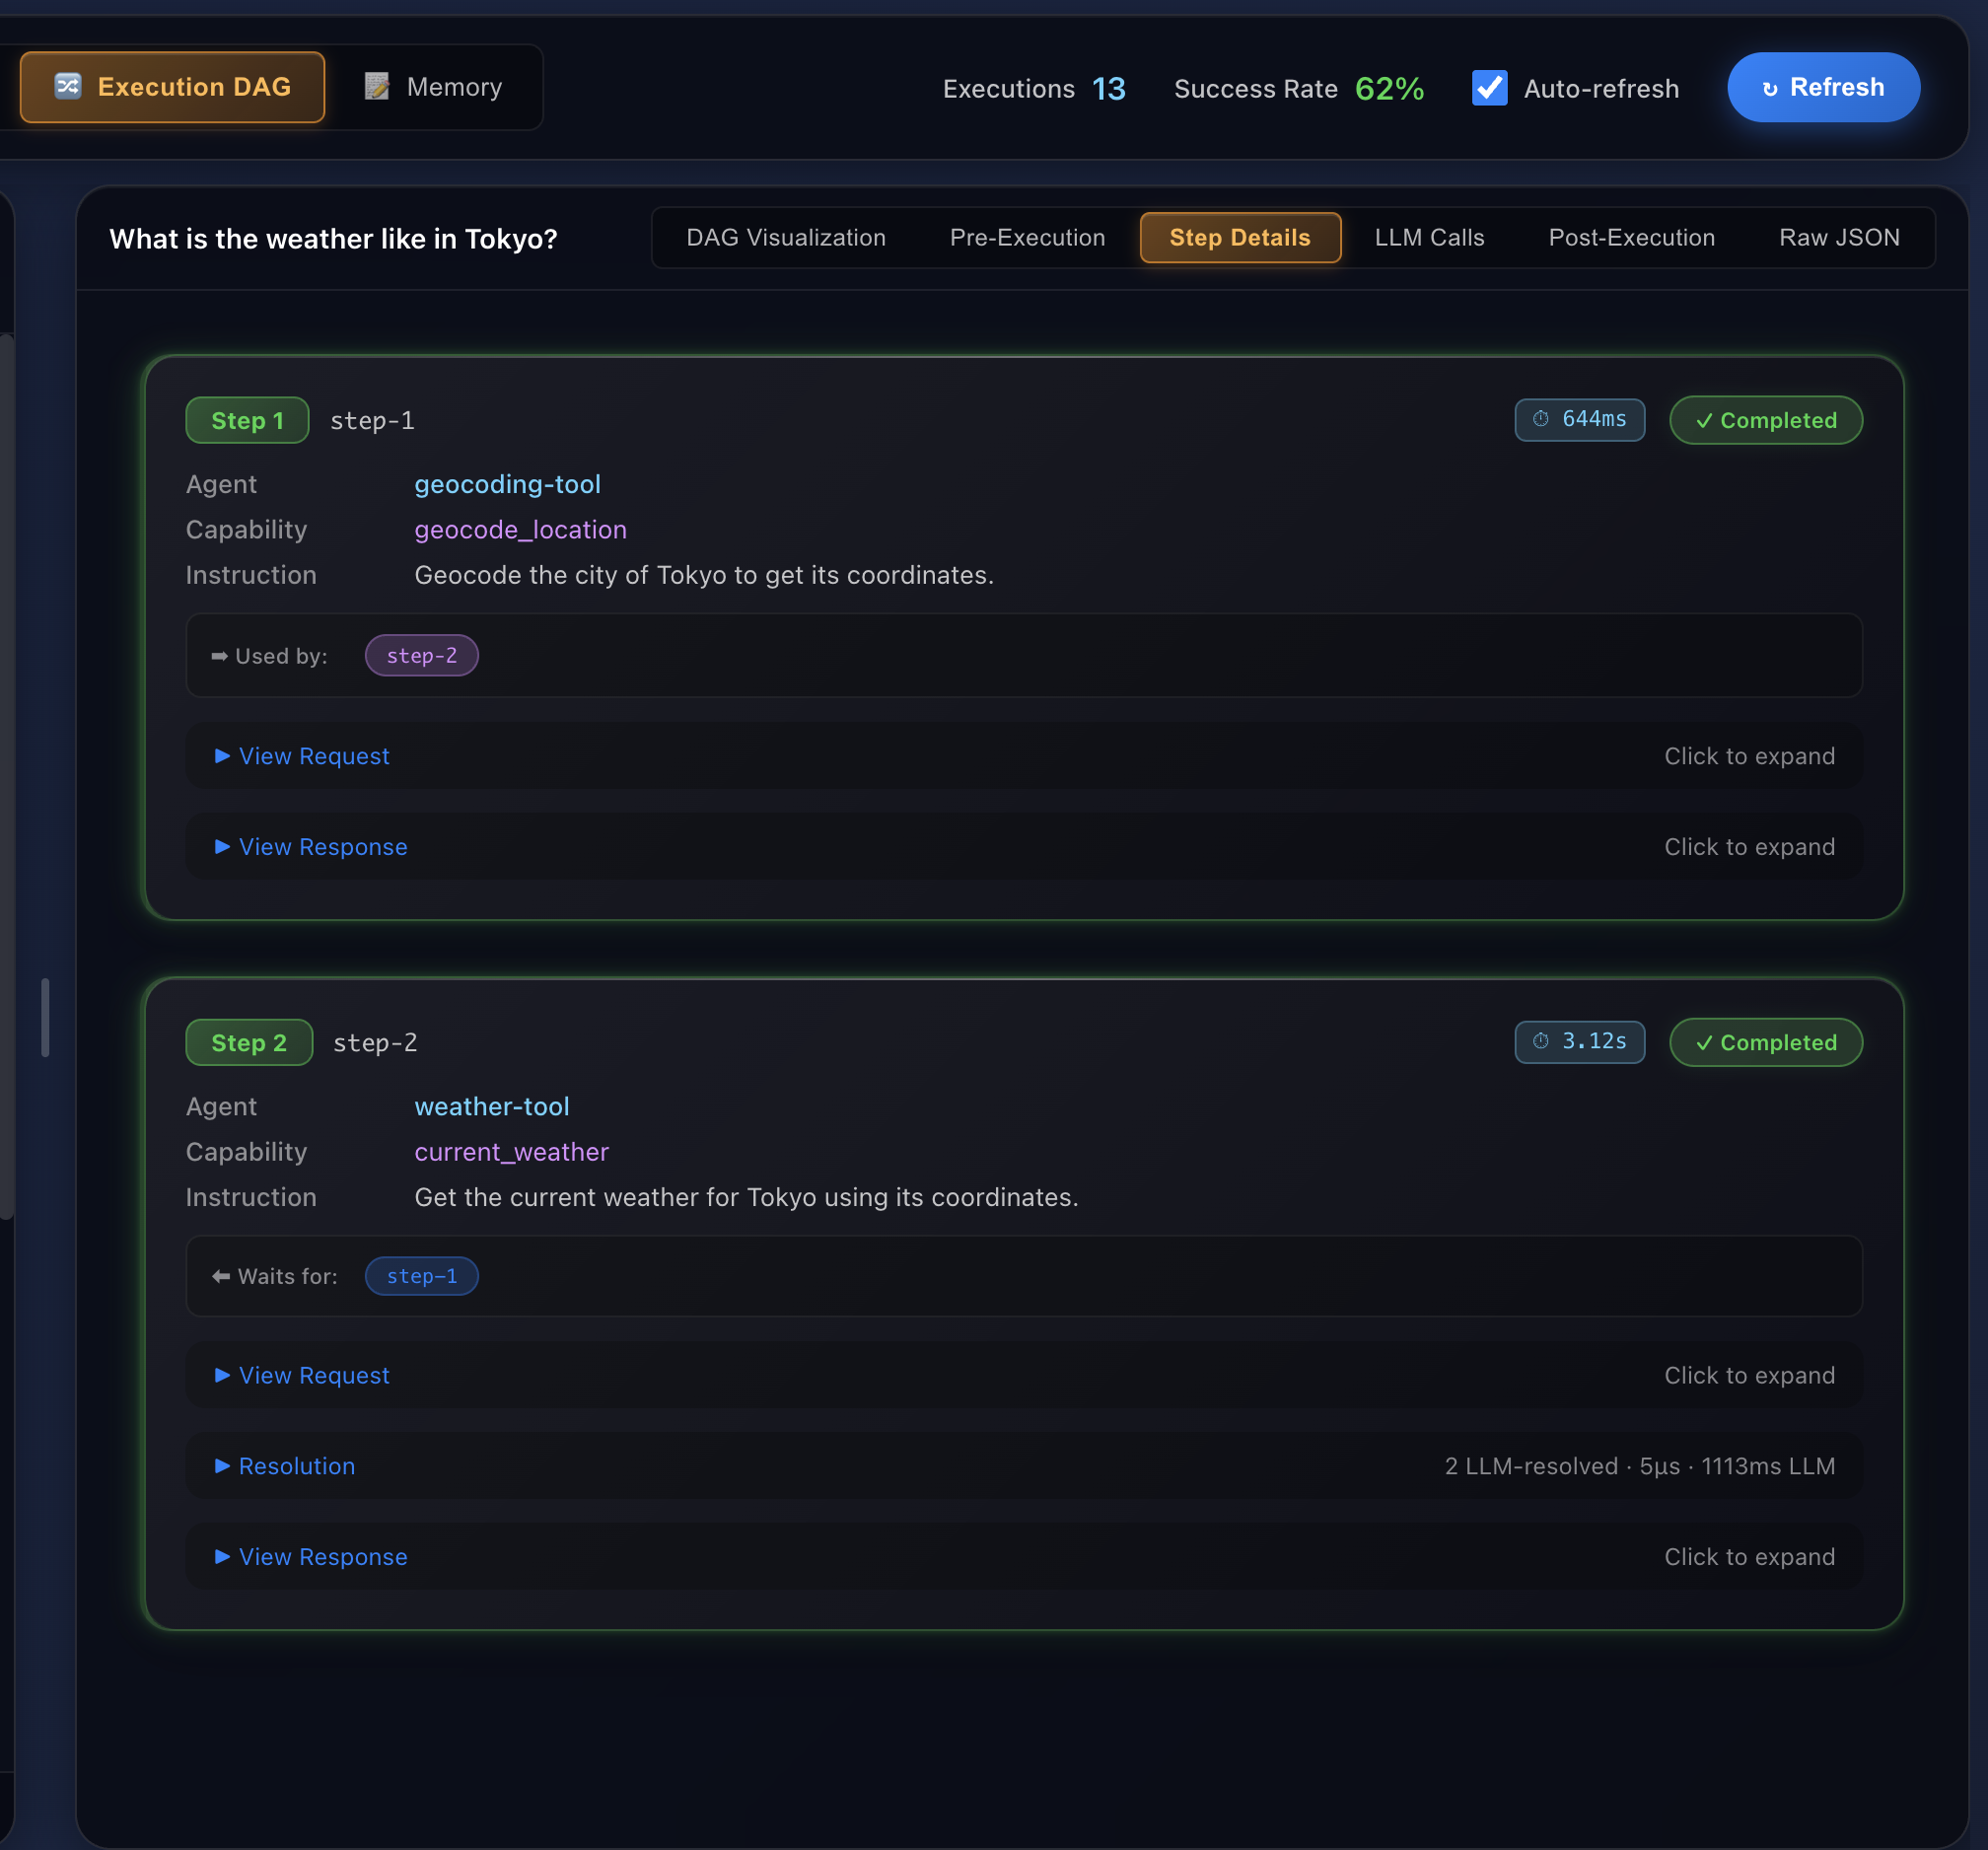
step-2 "waits for" step-1). Step-2's resolution line — "2 LLM-resolved · 1113ms LLM" — is the micro-resolution call from the trace, surfaced as a property of the step. The agent-native view ties the model call to the step it served; the trace only placed it in time.LLM Calls: the words themselves
This is the tab the trace cannot replicate, and the reason the second lens exists. The metadata layer — tokens, latency, cost — was already in the spans. The LLM Calls tab adds the content layer: the verbatim prompt sent to the model and the verbatim completion it returned, for every model call in the run.
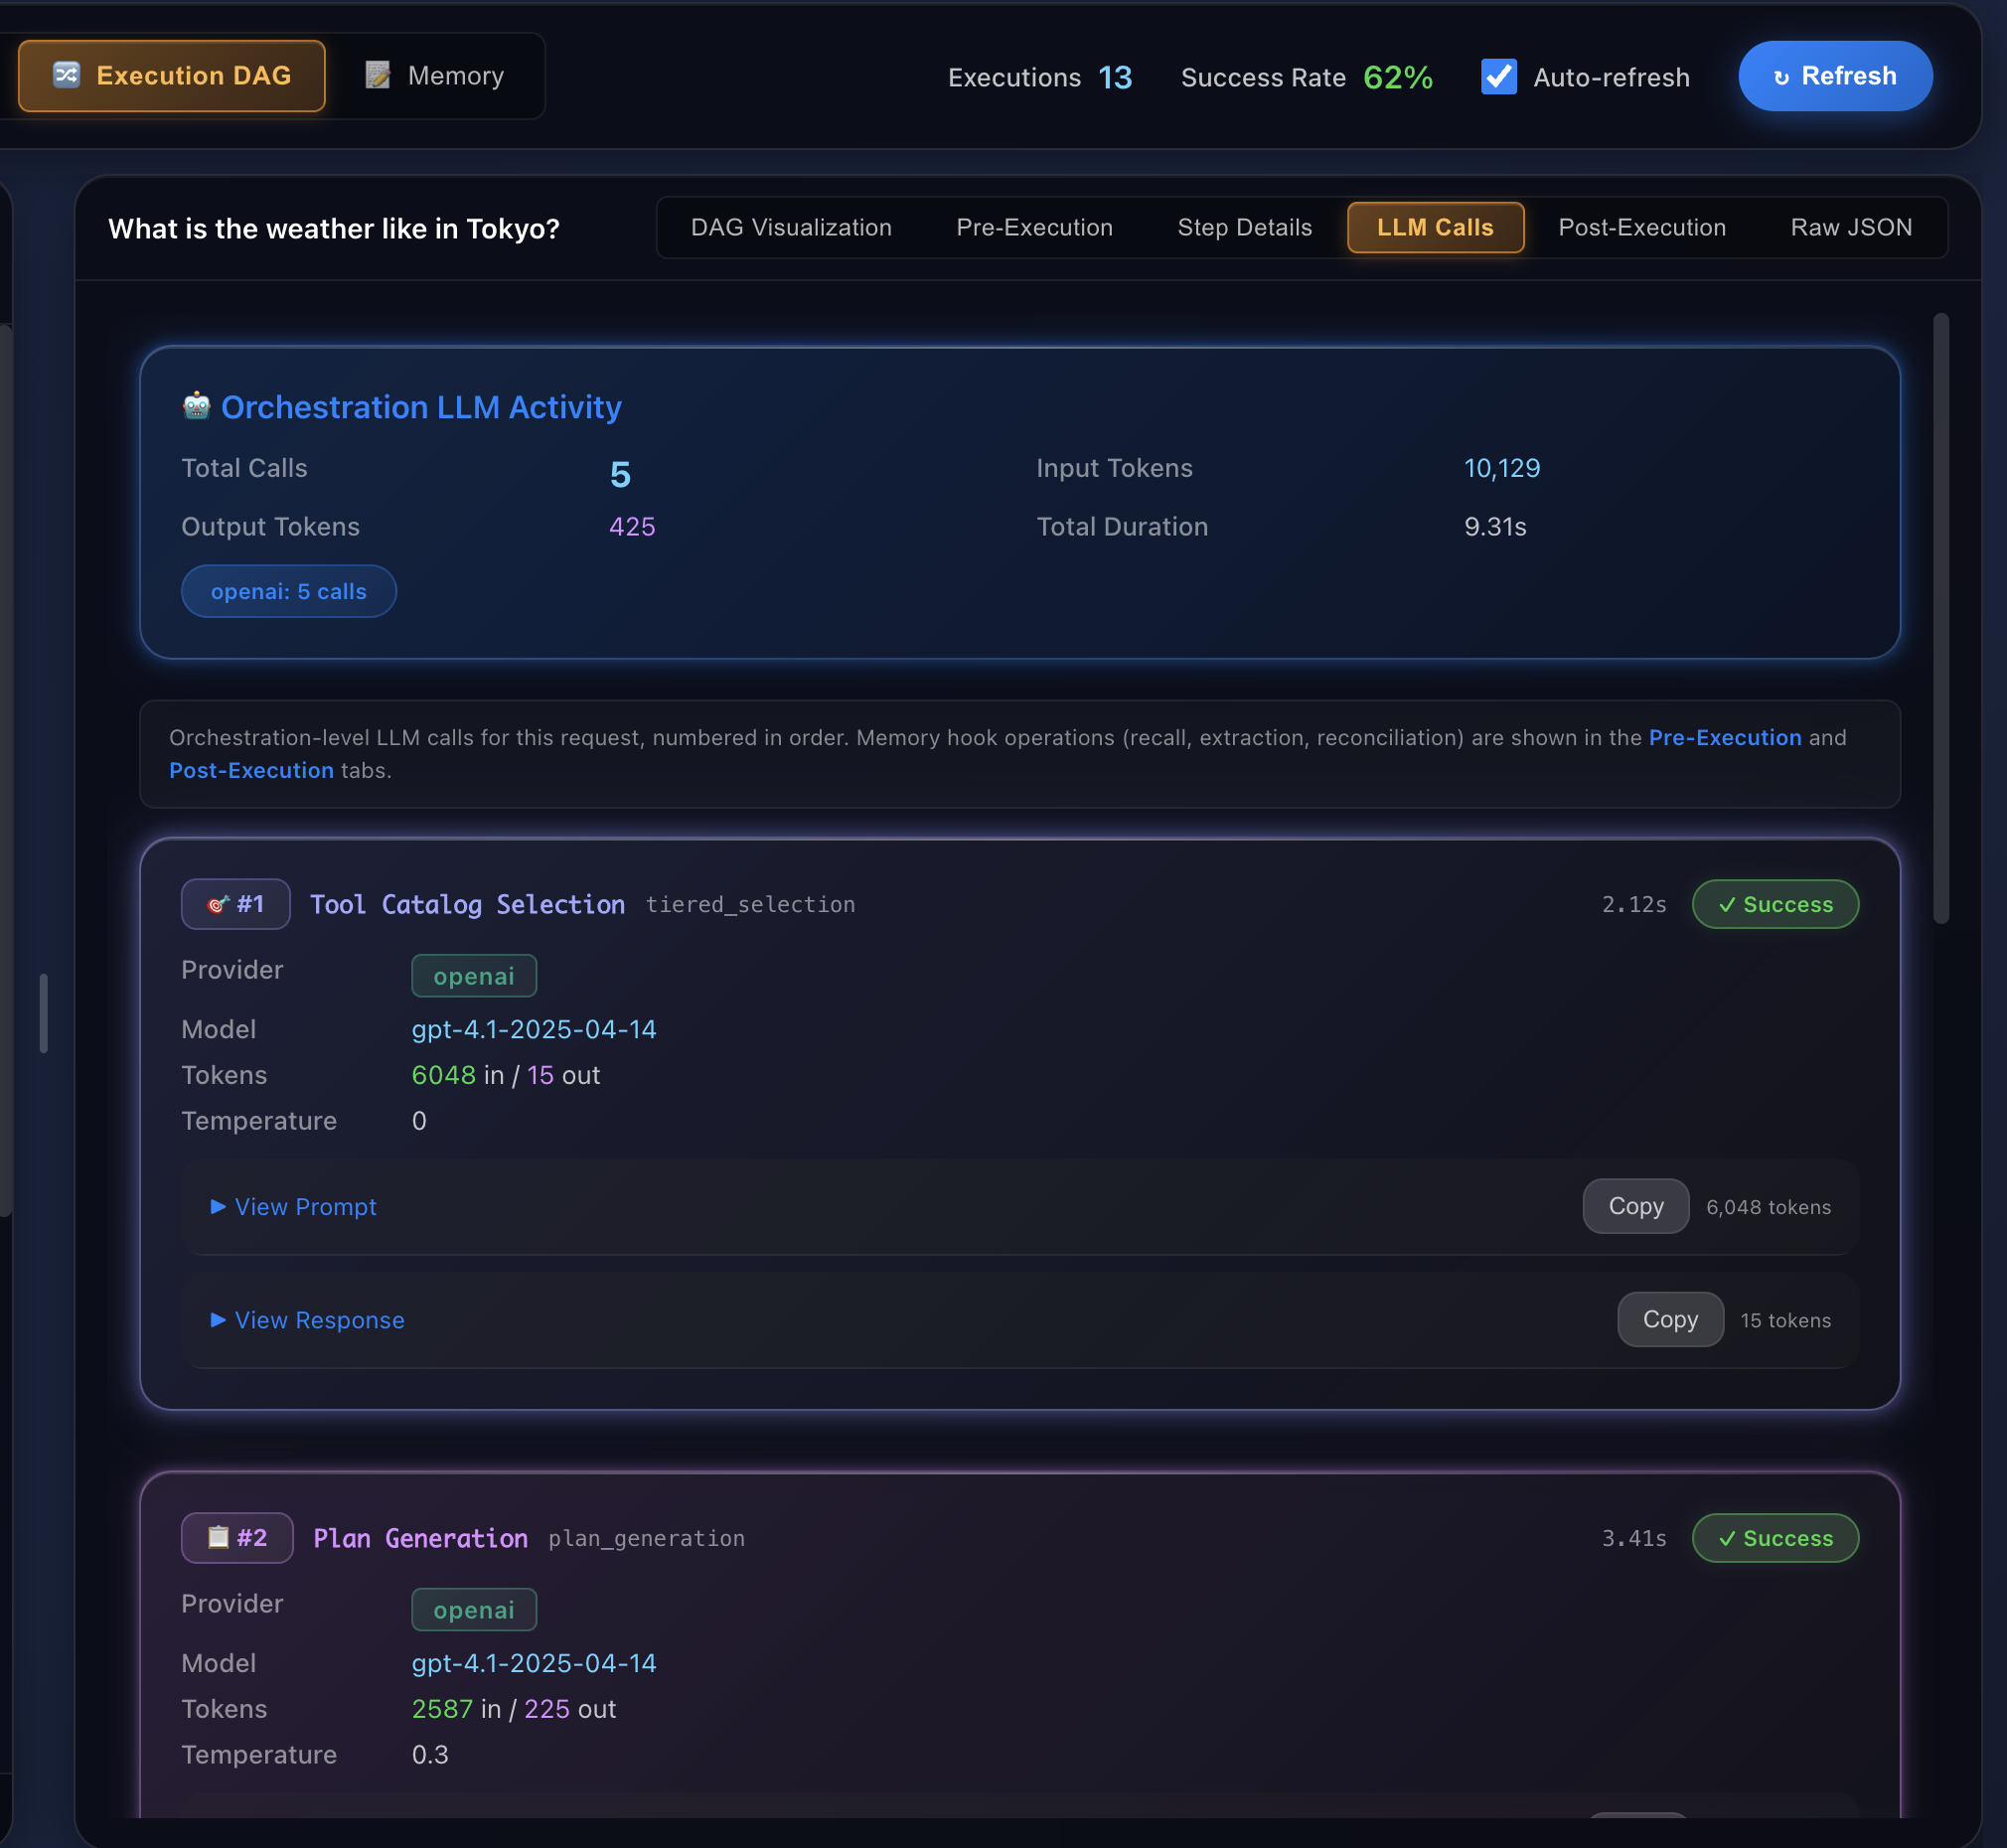
Expanding one shows what "content layer" means. Here is the plan_generation call opened up — the system prompt that defines the planning contract (order steps by dependency, use {{step-N.response.data.field}} templating, parallelize independent steps) on top, and the model's actual output, the executable plan, below it.
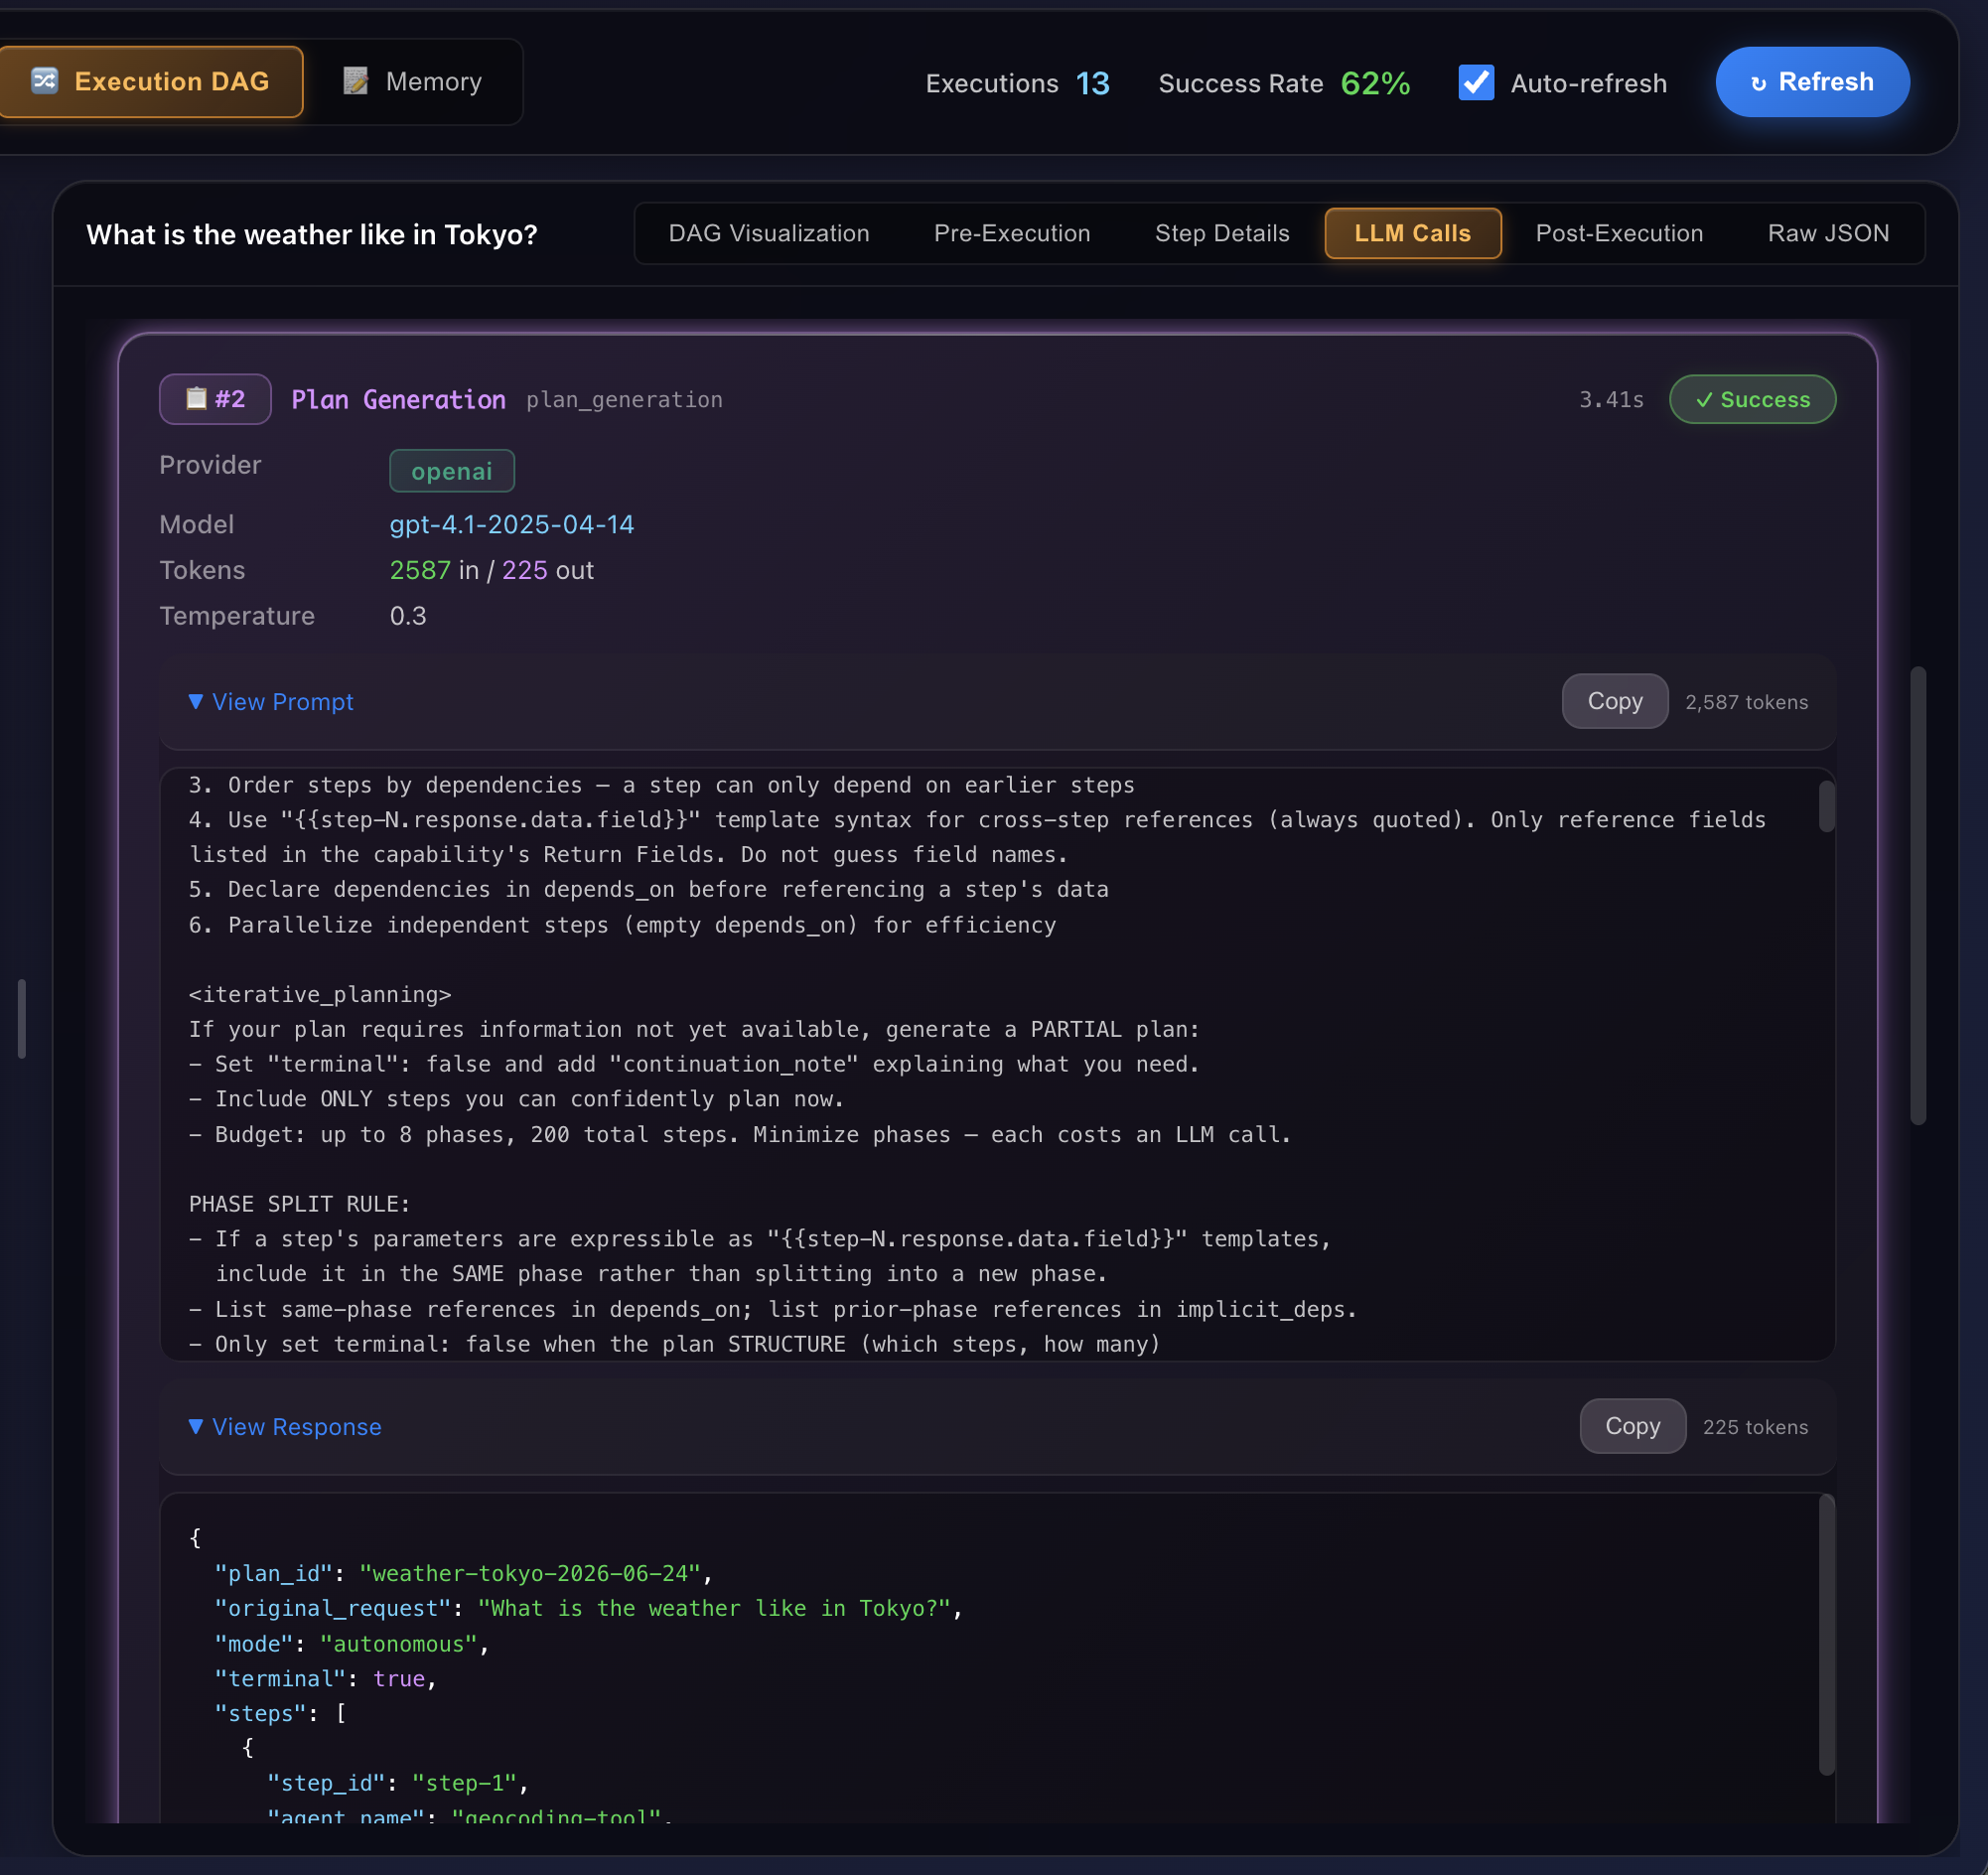
For this run, reading the responses is the fastest way to understand it end to end. The tool-selection call returned ["geocoding-tool/geocode_location", "weather-tool/current_weather"] — two capabilities chosen from the full catalog. The plan call turned that into an ordered, dependency-aware plan. The micro-resolution call returned the coordinates. The error-analysis call returned the "Tokyo, JP" fix. The synthesis call turned a JSON weather payload into the paragraph the user read. Five prompts, five responses, and the entire decision-making spine of the request is legible — not inferred from timings, but read directly.
Post-Execution: the work that outlived the answer
Recall the trace's final span — the memory-extraction hook that ran after the answer was sent. The Post-Execution tab is that hook's record: once the user has their reply, the agent spends another 1.5 seconds deciding what, if anything, to remember from the exchange.
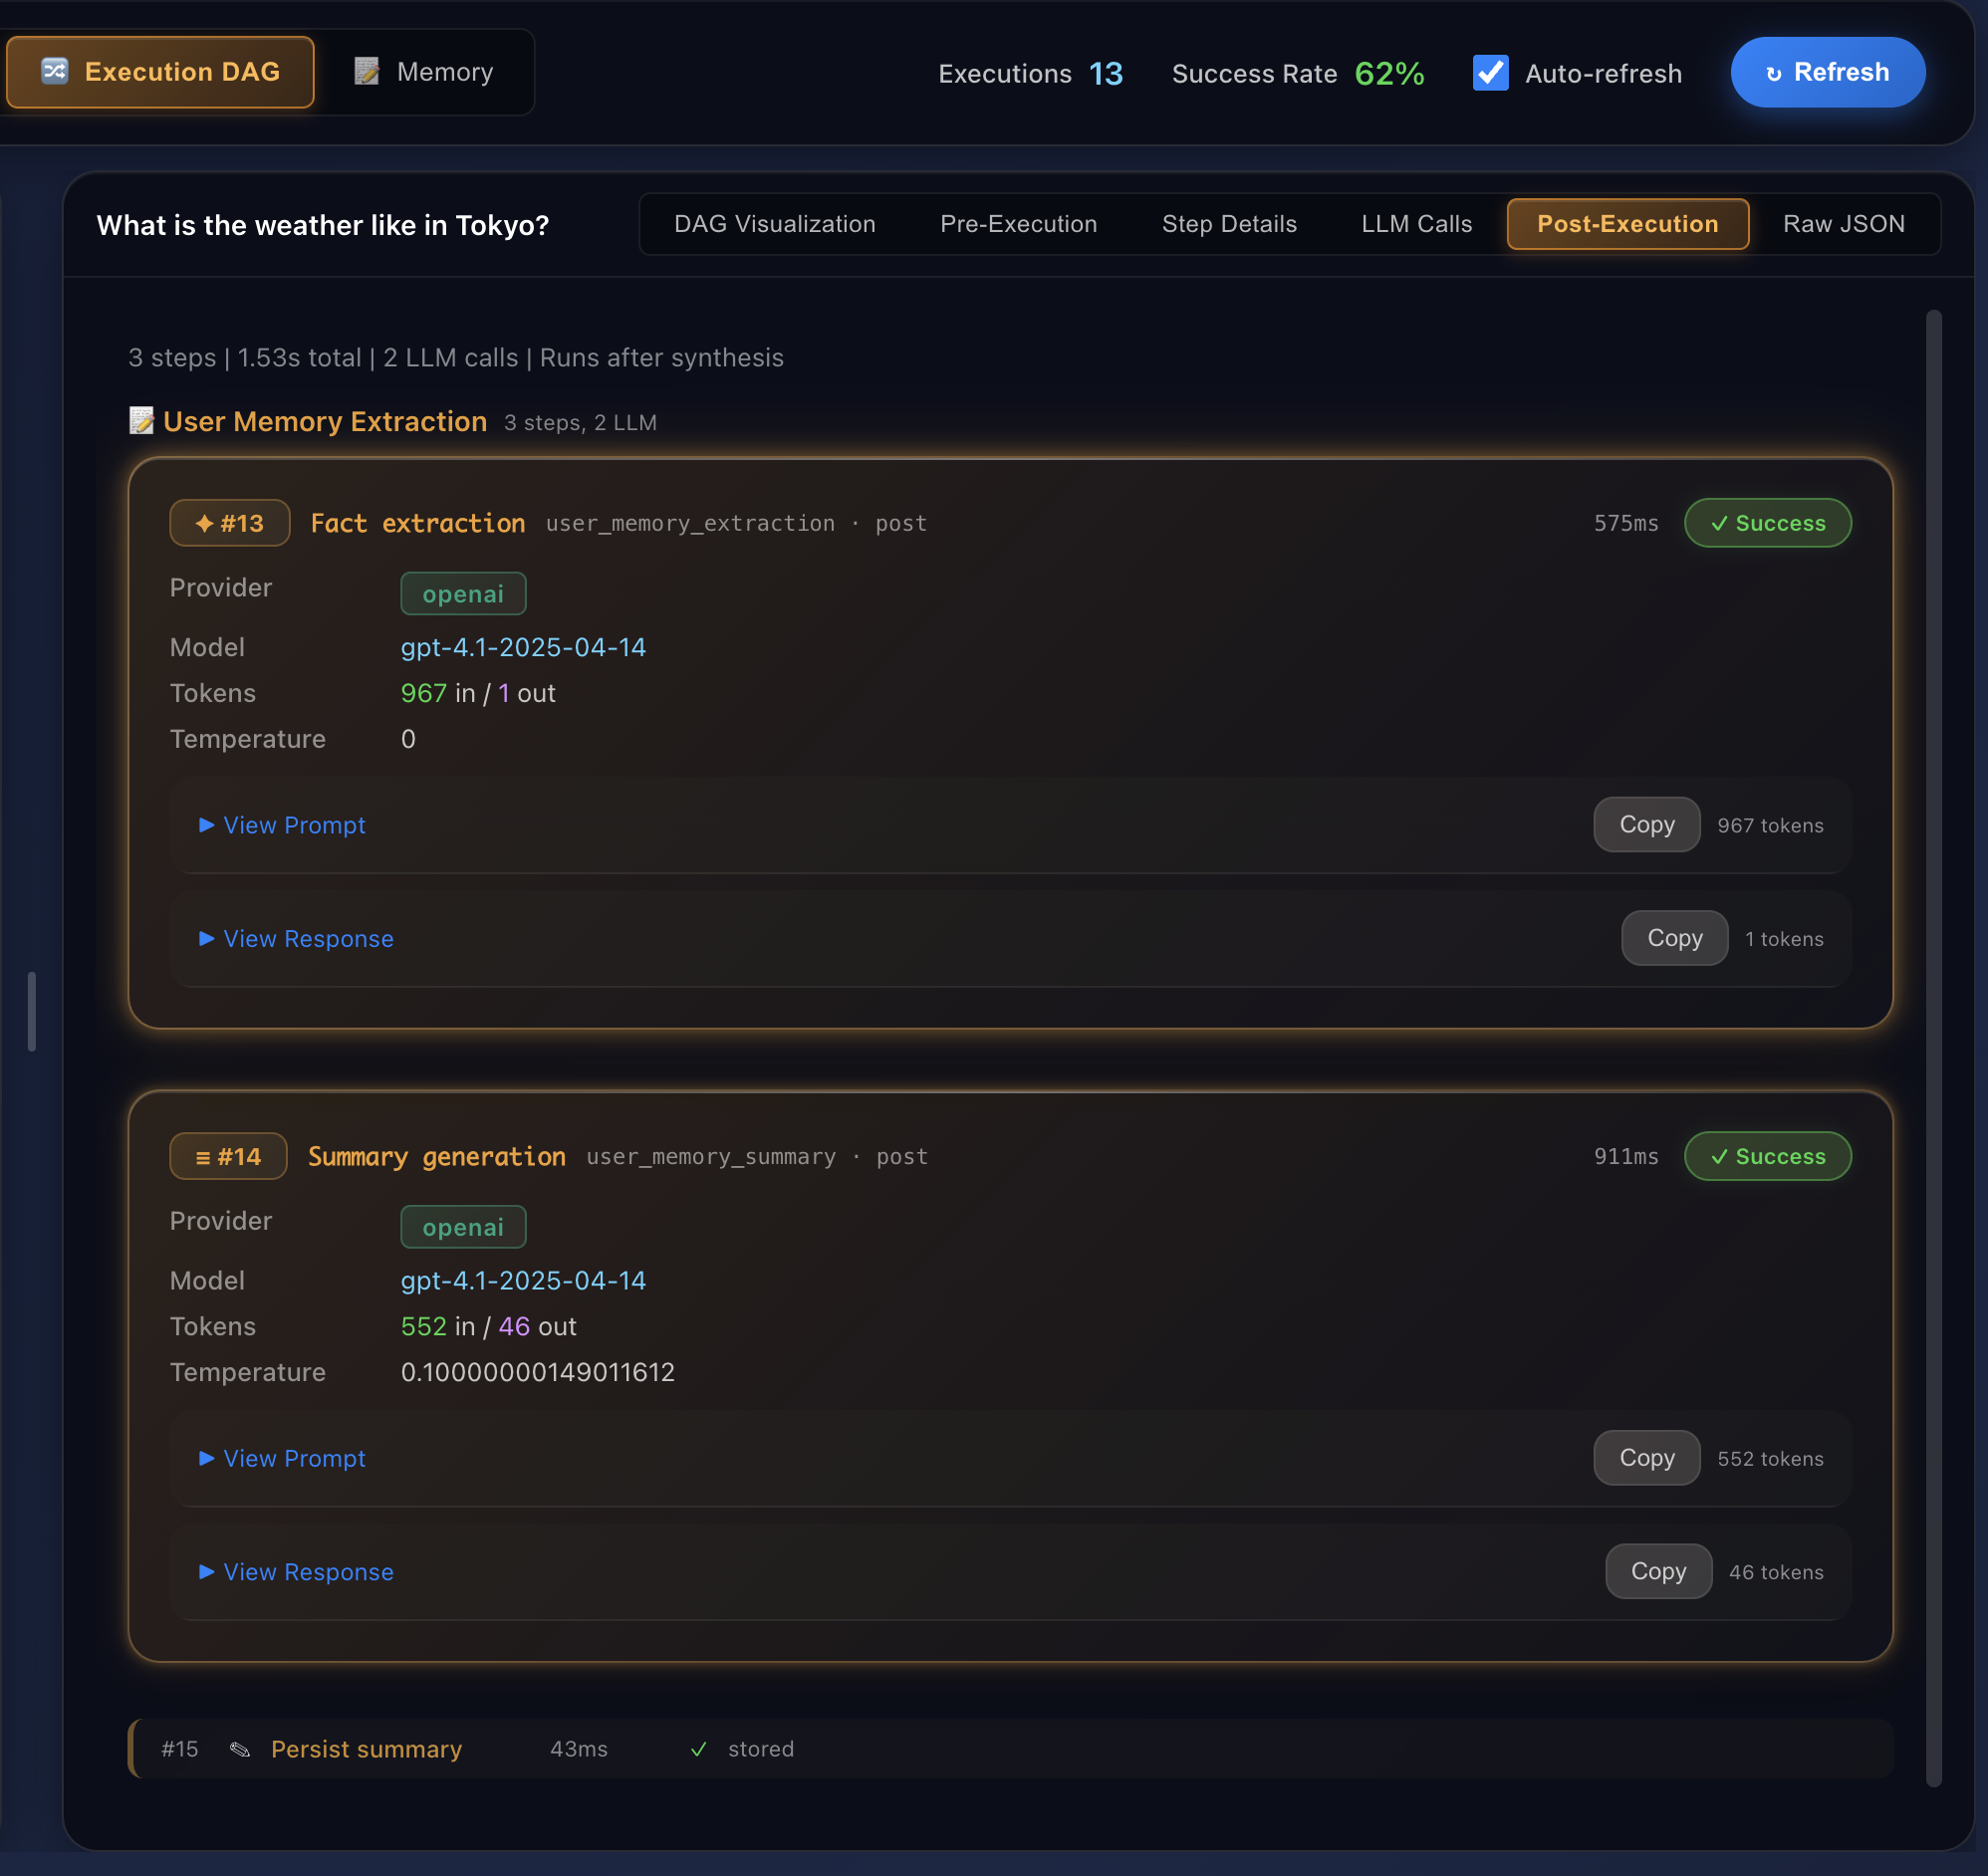
There is a Raw JSON tab as well — the complete execution record, the same file published with this article[16] — for when you want to read the source of truth directly rather than through a rendered view.
Four surfaces, four totals
We have now seen this one request clocked by four different surfaces, and a careful reader will have noticed they do not agree on how long it took. The chat footer said 11.0 seconds. The Jaeger trace said 12.5. The Execution DAG header said 20.84. The execution record's total_duration_ms said 9.65. They are all correct. They are measuring different things.
The differences are not noise; each boundary answers a real question. 9.65 seconds is the executor's plan-and-act loop — it stops when phase.1 ends, before the answer is synthesized, and it is the number the framework logs as "Phase loop completed." 11.0 seconds is the root HTTP span: the time the user actually waited for their answer, and the one number that should drive a latency SLO. 12.5 seconds is the full extent of the trace, which keeps recording the post-synthesis memory hook after the response has streamed — useful for capacity planning (the agent is still doing work) but wrong for an SLO (the user is already gone). 20.84 seconds is the registry-viewer's roll-up, which deliberately sums the executor time and the total LLM time (9.65 + 11.19); because several model calls overlap with execution, this double-counts on purpose, to answer "how much total work happened?" rather than "how long did the wall clock run?"
The tokens split for the same reason: 10,554 counts the five orchestration calls the chat UI considers part of "answering," while 12,120 counts all seven model calls — those same five plus the two post-execution memory-hook calls. The call count splits the same way: five orchestration calls, seven model calls including the two inside the post-execution memory hook, or the registry-viewer's fifteen — which numbers every recorded interaction, the seven that reached a model provider plus eight memory-and-bookkeeping steps. The lesson is not that one tool is wrong. It is that "how long did it take" is under-specified for an agent, and a mature observability setup makes the measurement boundary explicit rather than hiding it behind a single number. Knowing which surface answers which question is the actual skill.
What this costs you to run
None of this required a proprietary platform. The traces, metrics, and logs are emitted over OTLP to a standard OpenTelemetry Collector[13], which routes them to Jaeger, Prometheus, and Loki — the same open-source backends a great many clusters already operate, with Grafana over the top[7]. We focused on traces and logs in this walkthrough because they tell the story of a single request best, but the metrics pillar is fed by the same pipeline: the per-call token counts, latencies, and error flags you saw as span attributes are also aggregated into Prometheus series, where they answer the fleet-level questions ("p95 planning latency this week," "token spend by agent") that a single trace cannot.
The one bespoke component is the registry-viewer itself[6] — and it is a thin reader, not a control plane. It renders an execution debug store the framework writes when enabled; it holds no privileged position in the request path, and turning it off changes nothing about how requests are served. The content layer it surfaces — the verbatim prompts and responses — is gated behind an explicit flag, for the cost and privacy reasons in the callout above. The split is deliberate: the always-on metadata layer (structure, tokens, latency, cost, status) costs almost nothing and ships everywhere; the content layer is the high-value, higher-cost capability you switch on for the agents and environments that warrant it.
Run it yourself
Nothing in this article is a mock-up. The reference implementation, TruvaG3[1], is open source and runs on a laptop in a local Kubernetes (kind) cluster; the Getting Started guide[5] brings up the full stack — Redis, the OpenTelemetry Collector, Jaeger, Prometheus, Loki, Grafana, and the registry-viewer — alongside the bundled example tools and agents[4]. Deploy the examples, ask travel-chat-agent the same question, and the same surfaces light up: the trace at jaeger.localhost, the logs in Grafana, and the Execution DAG at registry.localhost. The Dev Tools guide[14] walks through the registry-viewer tab by tab.
And because the point of an observability deep dive is that you can check it, the three primary artifacts for this exact run are published alongside the article: the full execution record[16], the raw 52-span Jaeger trace[17], and the 106 correlated log lines[18] — every duration, token count, and status code in the figures above is taken directly from these files.
Conclusion
The user asked about the weather and got a clean paragraph in eleven seconds. That paragraph was true, but the sentence "it worked" was hiding a 404, a self-diagnosis, and a recovery that the agent performed without anyone watching — except that, with the right observability, everyone could watch. We saw the failure as a red span in a trace, as structured events on the step that recovered, and as ERROR lines in a log stream, all stitched together by a single identifier; and we saw the reasoning behind the recovery — the exact error the model read and the exact fix it proposed — in a view built for the purpose.
That is the whole argument. Generic, vendor-neutral tracing gives you the structure, the timing, and the correlation for free, and it carries you further than you might expect — far enough, here, to catch a failure the interface hid. An agent-native view gives you the layer that tracing structurally cannot: the plan, the prompts, the intent. You want both, because the question you will eventually need to answer about an agent is never just "how long did it take" — it is "what did it decide, and why, and what almost went wrong." For this request, every one of those questions has a precise, sourced answer. That is what observability is for.
References
- TruvaG3 — repository. Open-source reference implementation; all traces, logs, and screenshots in this article were captured from its bundled examples running in a local Kubernetes cluster. https://github.com/truvaagents/truva-g3
- TruvaG3 —
telemetry/package. The OpenTelemetry-native telemetry layer: OTLP export of traces and metrics, structured logging, W3C baggage-based correlation, and the Gen-AI span attributes (ai.model,ai.purpose,ai.prompt_tokens, …) shown in Figure 6. https://github.com/truvaagents/truva-g3/tree/main/telemetry - TruvaG3 —
orchestration/package. The per-agent orchestrator that produces the plan-act-observe loop traced in this article — tiered tool selection, plan generation, step execution with micro-resolution and error-analysis recovery, and synthesis. https://github.com/truvaagents/truva-g3/tree/main/orchestration - TruvaG3 —
examples/directory. The bundled tools and agents, includingtravel-chat-agentandgeocoding-tool, plus the shared observability infrastructure deployed by the setup scripts. https://github.com/truvaagents/truva-g3/tree/main/examples - TruvaG3 —
GETTING_STARTED.md. Step-by-step setup for the local-Kubernetes deployment, including Redis, the OpenTelemetry Collector, Jaeger, Prometheus, Loki, Grafana, and the registry-viewer. https://github.com/truvaagents/truva-g3/blob/main/GETTING_STARTED.md - TruvaG3 —
examples/registry-viewer-app/. Source for the registry-viewer web app whose Execution DAG view (Figures 11–16) renders the per-run execution debug store. Served athttp://registry.localhost/when the bundled local setup is running. https://github.com/truvaagents/truva-g3/tree/main/examples/registry-viewer-app - TruvaG3 — observability whitepaper. "Operational Excellence — Observability," the project's longer treatment of the metadata / content / destination layering used informally in this article. https://truvag3.dev/whitepapers/operational-excellence-observability.html
- OpenTelemetry — Observability primer. The "three pillars" framing (traces, metrics, logs) and the role of context propagation in correlating them. https://opentelemetry.io/docs/concepts/observability-primer/
- TruvaG3 —
examples/travel-chat-agent/. Source for the agent whose single Tokyo-weather execution is the basis for this entire article. https://github.com/truvaagents/truva-g3/tree/main/examples/travel-chat-agent - OpenTelemetry — Semantic conventions for generative AI. The Gen-AI span and attribute conventions (model, token usage, finish reason, and related fields) that TruvaG3's LLM spans follow. https://opentelemetry.io/docs/specs/semconv/gen-ai/
- W3C — Trace Context. The
traceparent/tracestatepropagation standard that ties the agent's spans, the tools' spans, and the log lines to onetrace_id. https://www.w3.org/TR/trace-context/ - TruvaG3 — Agentic Memory (companion article). How the shared, four-tier memory system that fed the pre-execution recall hook and the post-execution extraction hook works. https://truvag3.dev/blogs/truvag3-agentic-memory.html
- OpenTelemetry Collector. The central OTLP receiver/exporter that fans the agent's traces, metrics, and logs out to Jaeger, Prometheus, and Loki. https://opentelemetry.io/docs/collector/
- TruvaG3 —
docs/operations/DEV_TOOLS_GUIDE.md. Operator's guide to the developer tooling, including a tab-by-tab overview of the registry-viewer and how it reads the execution debug store. https://github.com/truvaagents/truva-g3/blob/main/docs/operations/DEV_TOOLS_GUIDE.md - Jaeger / Grafana Loki. The open-source distributed-tracing and log-aggregation backends used in this article — https://www.jaegertracing.io/ and https://grafana.com/oss/loki/.
- TruvaG3 — execution record for this run (JSON). The full plan, per-step results, all fifteen LLM/hook interactions — with verbatim prompts and responses for the model calls — and the DAG metadata for request
orch-1782343703229248038. Memorized user-profile facts redacted to neutral placeholders. https://assets.truvag3.dev/blogs/observability/tokyo-weather-execution-record.json - TruvaG3 — raw Jaeger trace for this run (JSON). The complete 52-span trace
2fed28c3a0f9eeb3548060fe33e00494as exported by the Jaeger query API — every span's operation name, start time, duration, tags, and events. https://assets.truvag3.dev/blogs/observability/tokyo-weather-jaeger-trace.json - TruvaG3 — correlated log records for this run (JSON). The 106 structured log lines emitted by the request, each carrying the shared
trace_idand per-spanspan_id. (The published file's first entry is Loki's common-labels record — metadata, not one of the 106 lines.) User identifier redacted. https://assets.truvag3.dev/blogs/observability/tokyo-weather-logs-correlated.json - TruvaG3 — Distributed Tracing and Log Correlation Guide. The framework's reference for trace-context propagation (the W3C
traceparentheader carried by a server-side tracing middleware and a traced HTTP client),request_idspan attributes, trace-log correlation, and the Jaeger-by-tag and Loki query patterns used throughout this article. https://github.com/truvaagents/truva-g3/blob/main/docs/observability/DISTRIBUTED_TRACING_GUIDE.md
Cite as: Tripathi, N. (2026). The Failure You Didn't See: An Observability Deep Dive Through One TruvaG3 Request. https://truvag3.dev/blogs/truvag3-observability-deep-dive
© 2026 Neelabh Tripathi. Licensed under CC BY 4.0.